Workplace climate data analysis means systematically measuring the work environment using numbers, surveys and key performance indicators – rather than relying on gut feeling. Typical methods include employee surveys, pulse surveys and the eNPS (Employee Net Promoter Score). The insights gained help HR professionals derive concrete measures to improve the workplace climate and detect high turnover risk at an early stage.
What Is Workplace Climate Data Analysis?
Workplace climate describes the perceived quality of the working environment: how do employees experience leadership, collaboration, communication and recognition in their day-to-day work? Workplace climate data analysis is the systematic process of translating these subjective perceptions into measurable, comparable data.
The difference from a traditional annual survey lies in the approach: while one-off surveys deliver only a snapshot, continuous data analysis aims to identify trends, understand root causes and track the effectiveness of measures. It combines quantitative metrics – such as turnover rate or absenteeism – with qualitative feedback gathered through surveys and conversations.
Workplace climate data analysis is a sub-field of People Analytics, which refers to data-driven decision-making in HR. According to a study by the German Society for Human Resource Management (DGFP, 2023), however, only a small proportion of companies currently use HR analytics in a systematic way – meaning the untapped potential is considerable.
Why Data Instead of Gut Feeling?
The Risk of Operating Without Systematic Analysis
A poor workplace climate often remains invisible for a long time. Employees who have mentally checked out do not necessarily stand out in daily life – until they hand in their notice. The Gallup Engagement Index Germany (2024) consistently shows that a significant proportion of German employees have no strong emotional connection to their employer. The consequences are measurable: higher turnover, more sick days and lower productivity.
Without data, HR teams frequently react too late and to symptoms rather than causes. A resignation is the result of a process – the actual warning signals, such as declining participation in team activities, increasing conflict or a rise in short-term sick leave, could often have been identified much earlier.
What Data Can Achieve
Data makes the invisible visible. It allows HR professionals to distinguish struggling teams from well-functioning ones, track shifts in sentiment over time and demonstrate the impact of HR initiatives. This not only creates better decision-making foundations – it also strengthens HR's position as a strategic partner at board level.
Methods of Workplace Climate Analysis
Employee Surveys (Annual)
The classic employee survey is the most comprehensive instrument available. It covers a wide range of topics: satisfaction with leadership, communication, team collaboration, development opportunities and company culture. It typically takes place once a year and comprises between 20 and 60 questions.
Its strength lies in depth: it delivers detailed insights and enables cross-departmental comparisons. Its drawback is frequency – a year is a long time, and problems can escalate in the interim.
Pulse Surveys (Regular)
Pulse surveys are short, regular surveys containing 2 to 10 questions. They are conducted weekly, monthly or quarterly and provide rapid snapshots of employee sentiment. Because of their low time commitment, participation rates tend to be higher than for lengthy annual surveys.
Pulse surveys are particularly well suited to responding quickly to specific events – such as a reorganisation, a new leadership team or a period of crisis. They do not replace the annual survey, but complement it meaningfully.
eNPS – Employee Net Promoter Score
The eNPS is the simplest of all measurement instruments: a single question. Employees are asked how likely they would be to recommend the company as an employer – on a scale of 0 to 10.
The calculation: Promoters (score 9–10) minus Detractors (score 0–6) equals the eNPS. The result ranges from –100 to +100. A positive value is considered good; a value above +30 is considered strong. Thanks to its simplicity, the eNPS is well suited to monthly trend monitoring and allows quick comparisons over time.
Qualitative Methods: Interviews and Focus Groups
Numbers do not explain why something is happening. Qualitative methods help to uncover the underlying context. In structured interviews or moderated focus groups, employees can speak openly about their experiences. These methods are particularly useful for deepening the findings from surveys or investigating specific problem areas.
The downside: qualitative methods are time-intensive, require trained facilitators and produce results that are difficult to aggregate.
Passive Data: Turnover, Absenteeism and Overtime
Alongside active surveys, HR systems provide valuable passive data. The voluntary turnover rate shows whether employees are choosing to leave the organisation – making it a strong indicator of the climate. The absenteeism rate (sick-day frequency) is considered an early warning signal for overload or dissatisfaction. Systematic overtime or unused annual leave can also point to underlying problems. These data points are available without additional effort and should be reviewed on a regular basis.
The Most Important KPIs and Metrics
A structured workplace climate analysis draws on several metrics simultaneously. The table below provides an overview of the key indicators:
Important: metrics should never be viewed in isolation. A high absenteeism rate in one department only becomes meaningful when analysed in comparison with other areas or tracked over time.
From Analysis to Action: How to Use the Results
Communicating Results Internally
One of the most common mistakes after employee surveys: the results disappear into a drawer. This destroys trust and willingness to participate in future surveys.
Communicate the results transparently – even when they are uncomfortable. Employees want to know what happens with their feedback. A clear message after the survey might sound like: "We heard you. Here is what we will change. And here is our timeline."
Deriving and Prioritising Measures
Not everything can be improved at once. Focus on 2 to 3 areas of action with the greatest leverage. A simple prioritisation matrix is helpful: how severe is the pain point? How feasible is the solution? Measures with high impact and realistic implementation come first.
Define clear owners, goals and a timeframe for each measure. Without this structure, good intentions remain just that.
Measuring Effectiveness
Measures must be verifiable. Use follow-up metrics – such as a repeat pulse survey after three months or an eNPS comparison – to assess whether interventions are working. This cycle of measuring, acting and measuring again is the cornerstone of a data-driven HR culture.
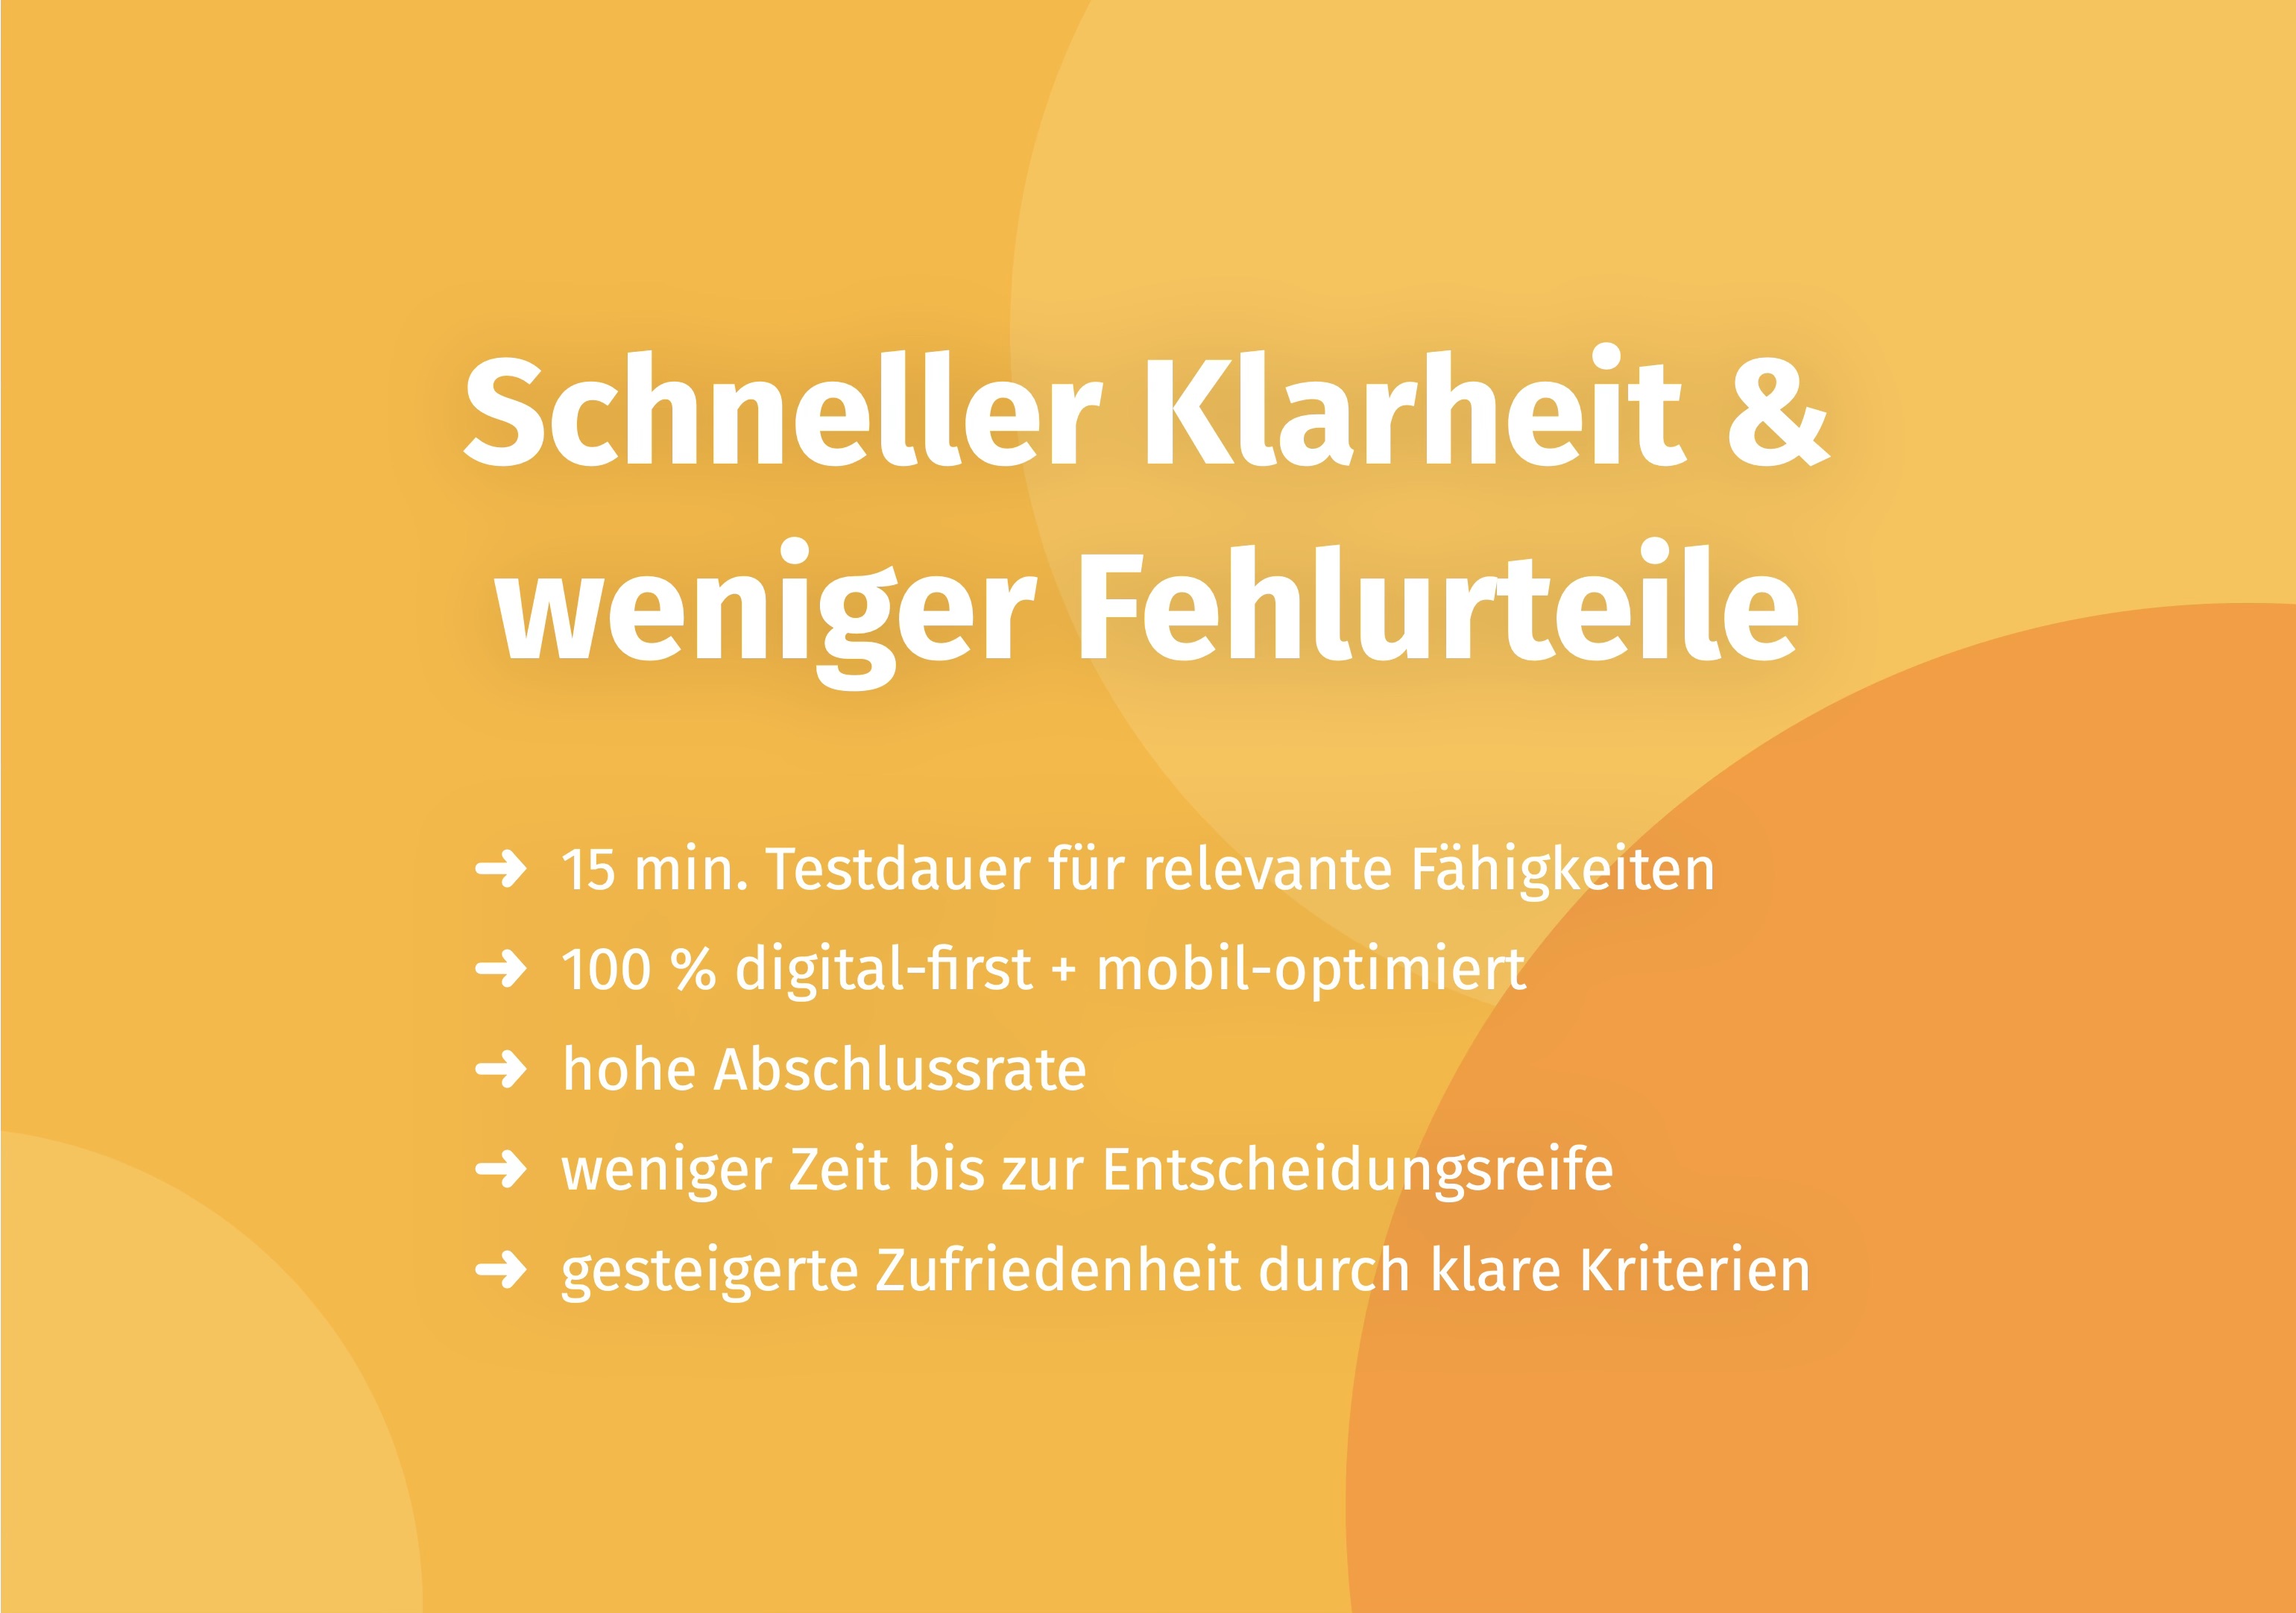
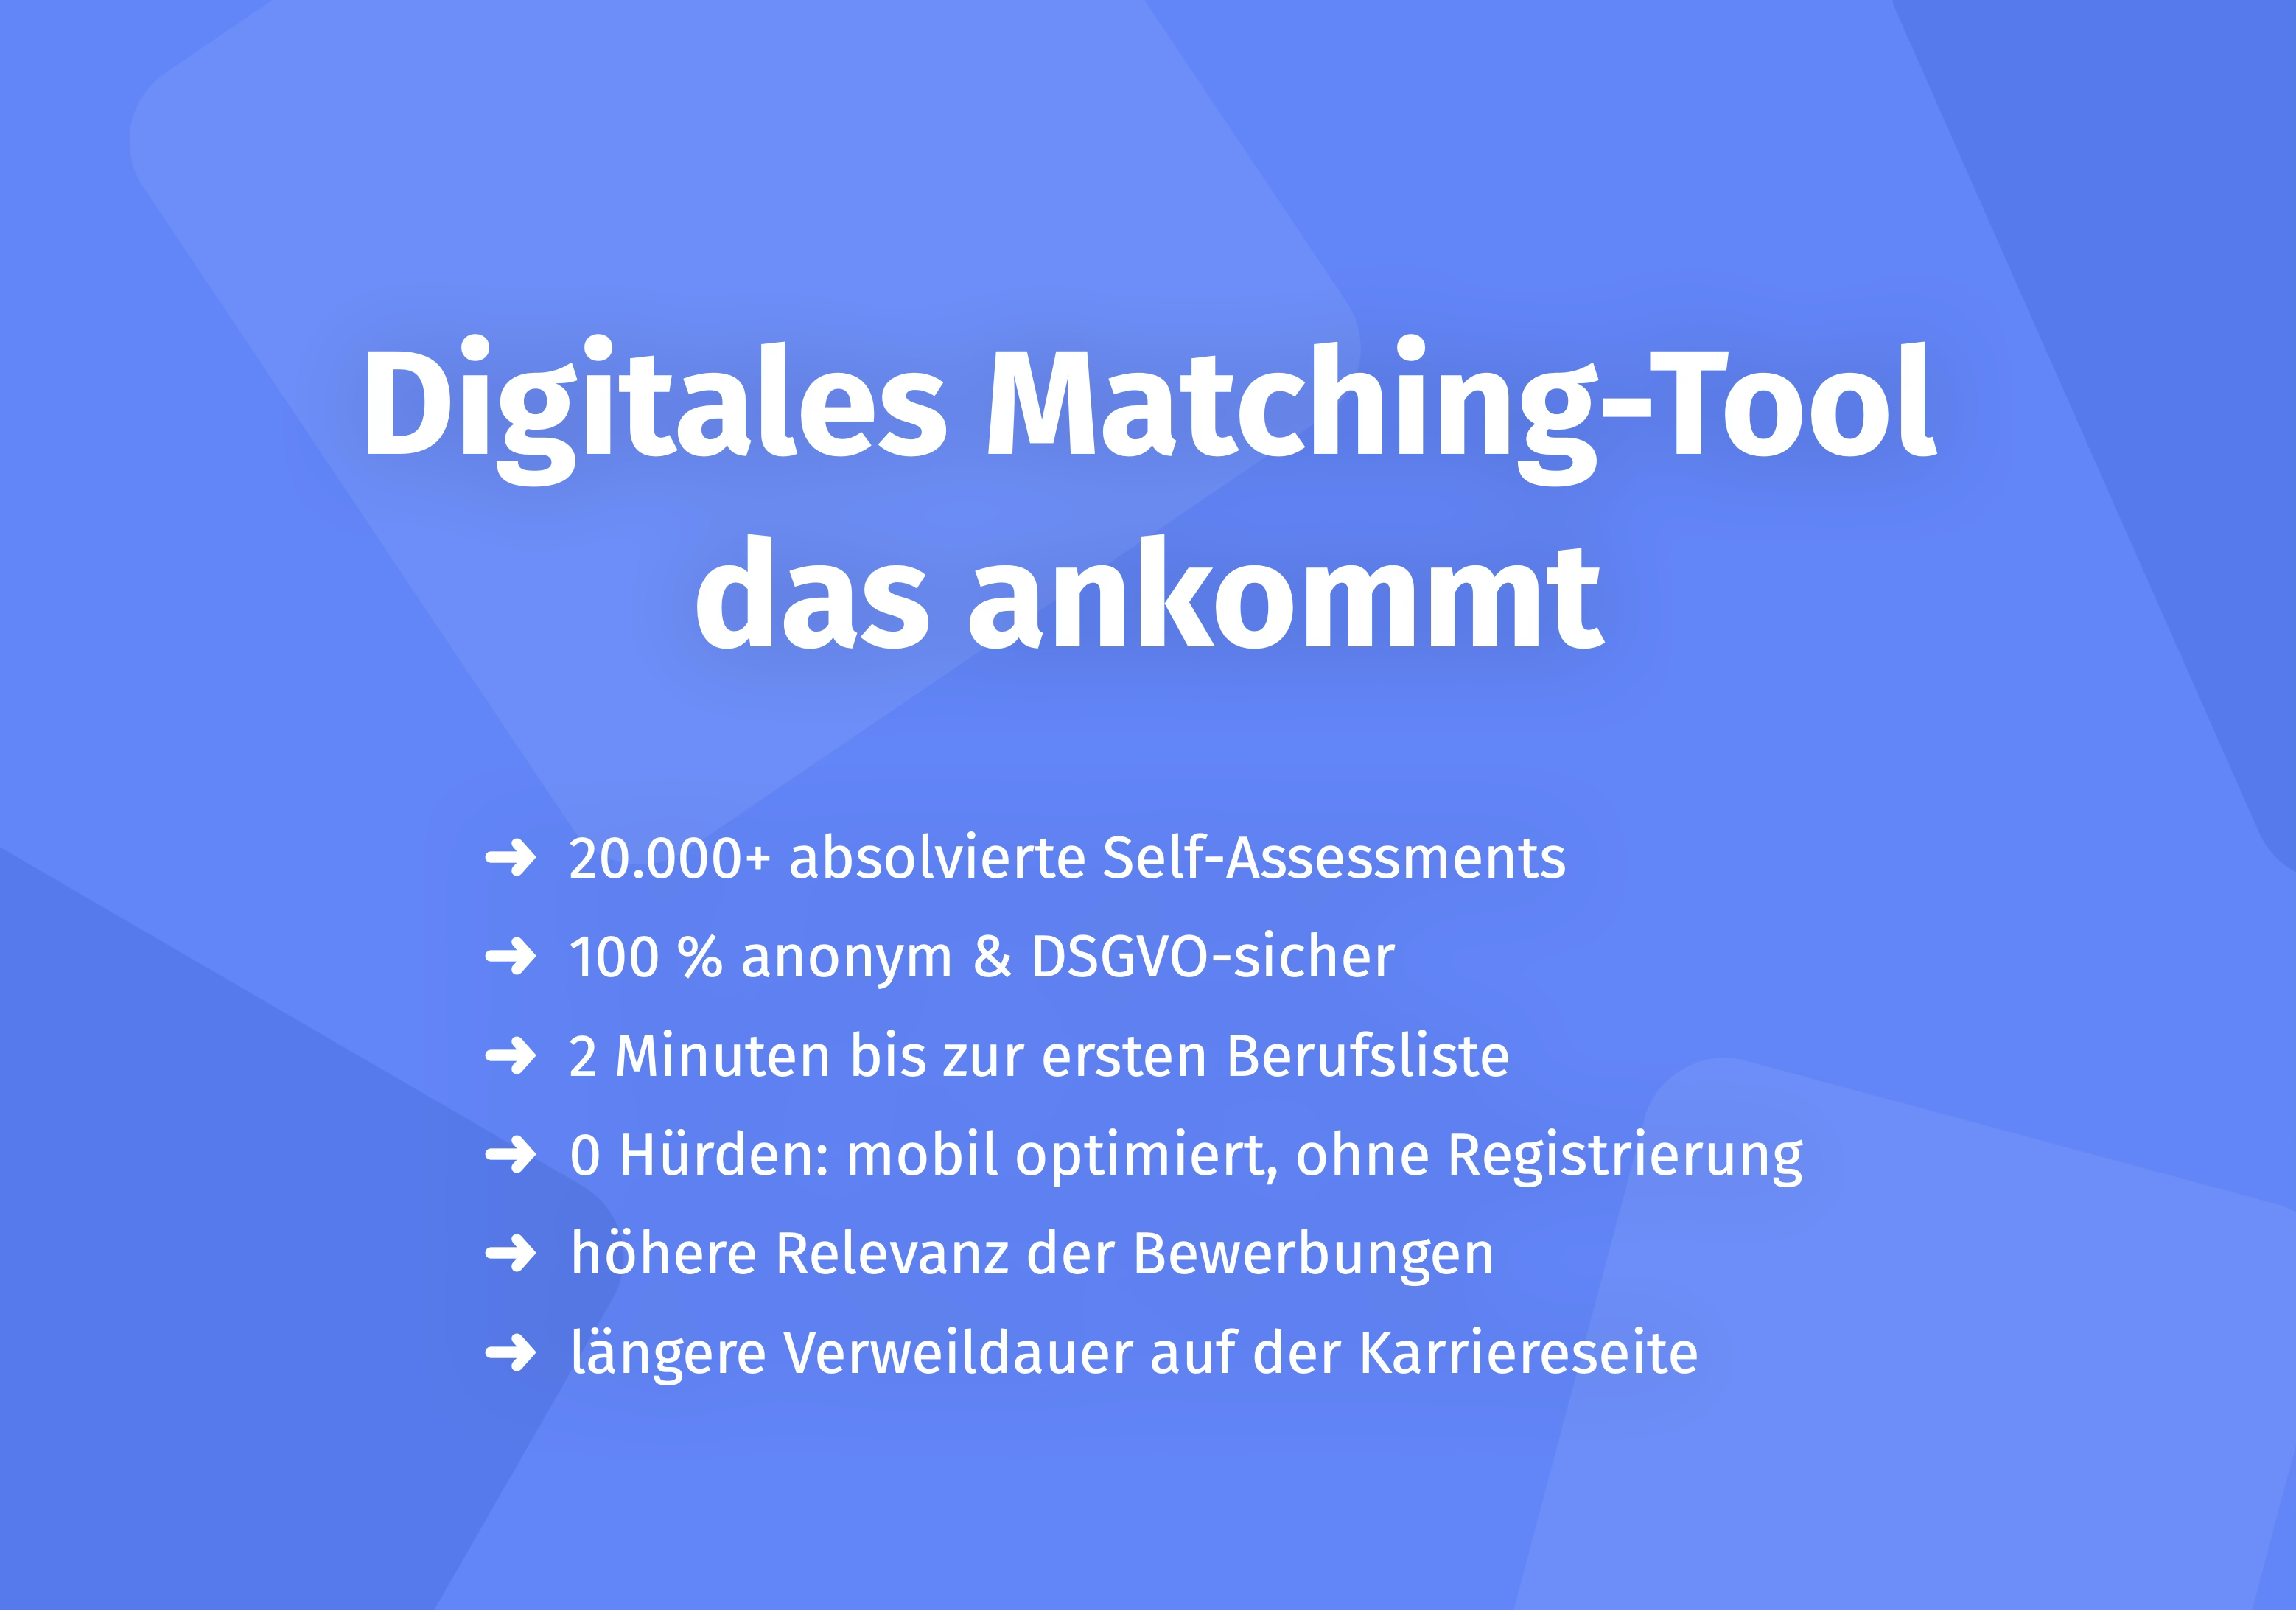
A further factor worth considering: the quality of hiring decisions has a lasting structural effect on workplace climate. Companies that look beyond qualifications during recruitment – considering personality, strengths and cultural fit – consistently report more cohesive teams and less internal friction. The digital platform Aivy supports HR teams in assessing these dimensions objectively using scientifically validated assessments. OMR, for example, uses objective talent diagnostics to make team strengths visible and enable strengths-based leadership – both of which directly influence workplace climate.
GDPR and Anonymity: What HR Professionals Need to Know
Employee data is personal data – and is therefore subject to the General Data Protection Regulation (GDPR). The following principles apply to workplace climate surveys:
Involve the works council: Under §87 of the Works Constitution Act (BetrVG), the works council has co-determination rights regarding measures relating to employee conduct and performance monitoring. Employee surveys generally fall within this scope. Involve the works council at an early stage.
Ensure anonymity: Make sure that individual results cannot be traced back to specific individuals. A minimum group size of five people for reporting purposes is an established best practice. Communicate this principle actively – employees will only respond honestly if they trust that their anonymity is protected.
Data minimisation: Only collect data that you will actually evaluate and act upon. Demographic characteristics such as department, age or length of service should only be requested where they are genuinely necessary for the analysis.
External tools: Use GDPR-compliant survey tools in which HR's access to data is clearly regulated. Many providers offer servers located within the EU and the relevant data processing agreements (DPAs).
Further guidance on related topics such as health in the workplace and error culture in organisations is available in the Aivy HR Lexicon.
Frequently Asked Questions about Workplace Climate Data Analysis
What does workplace climate data analysis mean?
Workplace climate data analysis is the systematic, measurement-based collection of data on employee sentiment, engagement and satisfaction within an organisation. It combines quantitative methods (metrics, scaled survey responses) with qualitative approaches (interviews, focus groups). The goal is a reliable foundation for action – rather than relying on assumptions.
What methods are available for workplace climate analysis?
The key methods are: annual employee surveys (comprehensive, strategic), pulse surveys (short, regular, 2–10 questions), the eNPS as a single-item metric, and qualitative in-depth interviews and focus groups. These can be supplemented by passive data from HR systems – such as turnover rate, absenteeism and overtime hours.
What is the eNPS and how is it calculated?
The Employee Net Promoter Score (eNPS) is based on a single question: "How likely are you to recommend this company as an employer?" (scale 0–10). Promoters (9–10) minus Detractors (0–6) equals the eNPS. The result ranges from –100 to +100. A positive value is a good sign; values above +30 are considered strong.
How do I ensure anonymity in employee surveys?
Use external, GDPR-compliant survey tools that prevent HR from accessing individual-level data. Set a minimum group size for reporting (recommended: at least 5 people). Actively communicate that results will only be presented in aggregated form. Involve the works council at an early stage and conclude a data processing agreement (DPA) with the tool provider.
Which KPIs matter most for workplace climate analysis?
The central metrics are: engagement rate (share of highly engaged employees), eNPS (likelihood to recommend as employer), voluntary turnover rate, absenteeism rate (sick-day absences) and pulse survey participation rate. These KPIs should be tracked over time and compared across departments.
How often should workplace climate be measured?
A combination of different frequencies is recommended: the annual employee survey provides deep, strategic insights. Quarterly pulse surveys allow quick operational responses. A monthly eNPS is suitable for continuous trend monitoring. Frequency should be guided by company size and available resources.
What should I do with the results?
Communicate the results transparently – even when they are uncomfortable. Prioritise 2 to 3 concrete areas of action with clear owners and timelines. Re-measure after 3 to 6 months to check whether measures are having the desired effect. Results that are met with no visible response will erode trust in future surveys.
What do I need to consider regarding GDPR?
Involve the works council in accordance with §87 BetrVG. Ensure the survey is anonymous and does not allow conclusions to be drawn about individual employees. Only collect data you genuinely need (data minimisation principle). Use GDPR-compliant tools with EU-based servers and conclude a data processing agreement (DPA). Legal advice on individual cases is recommended, particularly where sensitive data is involved.
Conclusion
Workplace climate data analysis is not a nice-to-have – it is a strategic instrument that enables HR professionals to identify problems early and act on the basis of facts. Whether it is an annual employee survey, a monthly eNPS or continuous pulse surveys: what matters is not the method alone, but the consistent cycle of measuring, communicating and acting.
Those who want to systematically improve workplace climate benefit from applying objective data at the recruitment stage too. Hiring employees with the right strengths, values and cultural fit from the outset lays the foundation for a healthy working environment. The digital platform Aivy supports companies in achieving this with scientifically validated assessments – GDPR-compliant and free from unconscious bias.
Learn more about objective talent diagnostics with the Aivy platform
Further information on related topics is available in the Aivy HR Lexicon articles on Cultural Fit and Potential Analysis.
Sources
- Gallup GmbH. Gallup Engagement Index Germany 2024. Gallup, 2024. https://www.gallup.com/de/engagement-index-deutschland
- Deutsche Gesellschaft für Personalführung (DGFP). People Analytics in Germany. DGFP Study, 2023. https://www.dgfp.de/studien
- Federal Ministry of Labour and Social Affairs (BMAS). Work of the Future – Commission Report. BMAS, 2023. https://www.bmas.de
- Schermuly, C. C. New Work – Gute Arbeit gestalten. Schäffer-Poeschel Verlag, 2022.
- Bitkom e.V. Digitalisation in HR – Bitkom Study. Bitkom, 2023. https://www.bitkom.org/Studien

Make a better pre-selection — even before the first interview
In just a few minutes, Aivy shows you which candidates really fit the role. Beyond resumes based on strengths.