An organisational chart is a visual representation of a company's structure – it shows who reports to whom, how departments are organised, and how decision-making flows. HR professionals use it for transparency, onboarding, and workforce planning. Depending on the company's structure, different types are suitable: from the classic line organisation to the modern matrix structure.
What Is an Organisational Chart? Definition
An organisational chart (from the Greek organon = tool and gramma = writing/sign) is a visual representation of an organisation's formal structure. At a glance, it shows which roles and departments exist, how they relate to one another, and who reports to whom – in other words, the so-called reporting lines (the direct relationship between an employee and their manager, represented by connecting lines in the diagram).
The organisational chart differs fundamentally from a staffing plan: while a staffing plan lists all planned and filled positions in tabular form (including full-time equivalents, pay grades, etc.), the organisational chart visualises the hierarchy and communication channels. Both documents complement each other but do not replace one another.
According to classical organisational theory (cf. Schreyögg & Geiger, 2016), the organisational chart is one of the fundamental instruments for documenting and communicating organisational structures.
What Is an Organisational Chart Used For?
Transparency and Communication Within the Company
A well-maintained organisational chart creates clarity: employees know who to turn to for which matters, and managers can communicate decision-making pathways and responsibilities unambiguously. This transparency is especially essential in growing companies where structures change frequently.
Onboarding: Orientation for New Employees
For new colleagues, the organisational chart is an indispensable orientation tool. It answers fundamental questions such as: Who is my direct manager? Which departments exist? Who is the contact person for topics like IT, HR, or legal matters? An up-to-date organisational chart noticeably reduces onboarding time and strengthens a sense of belonging from day one.
Workforce Planning and Recruitment
In an HR context, the organisational chart is a strategic planning instrument. It helps to locate open positions within the overall structure, visualise succession planning, and identify bottlenecks in the organisational structure early on. Anyone looking to fill a new position can quickly determine which reporting structure the person will be part of – and what requirements follow from that. For more on this, see the article on Internal Recruitment.
What Types of Organisational Charts Are There?
Organisational theory distinguishes several fundamental structural types (cf. Bea & Göbel, 2019; Mintzberg, 1979):
Line Organisation
The simplest and oldest form: each employee has exactly one direct manager. Decisions flow clearly from top to bottom. This structure is clear and well-suited for small and medium-sized companies with stable processes. Drawback: limited flexibility and long decision-making paths in larger organisations.
Line-and-Staff Organisation
Here, a staff position (a role with no direct line function, acting in an advisory capacity – e.g. legal department, controlling, corporate communications) supplements the classic hierarchy. Staff positions have no authority to issue directives but provide specialist knowledge to support the line. This form is widespread among mid-sized companies.
Matrix Organisation
In a matrix organisation, employees have two managers: typically a departmental manager (functional) and a project manager (project-based). This dual reporting structure enables high flexibility and promotes cross-functional collaboration – but it can also create potential conflicts and ambiguity when priorities clash. Common in larger, project-oriented companies.
Divisional Organisation
Here, companies are not organised by function (e.g. marketing, sales, HR) but by products, regions, or markets. Each division operates largely independently – with its own resources and responsibilities. This structure is suited to diversified corporations with a heterogeneous product portfolio.
Flat and Agile Structures
Modern, agile companies are increasingly opting for flat hierarchies with few levels and a high degree of employee autonomy. Organisational charts in these settings often look less like traditional pyramids and more like networked structures or circles. Concepts such as Cultural Fit become particularly important in such structures, as cultural alignment matters more than formal hierarchical conformity.
Creating an Organisational Chart: Step by Step
Step 1: Define Structures and Capture Roles
Before opening any tool, establish the content foundation: How many hierarchical levels are there? Which departments exist? Who reports to whom? Align this with your leadership team and use your staffing plan as a starting point.
Step 2: Choose the Right Tool
The choice of tool depends on company size, budget, and the desired level of currency:
- Lucidchart: Specialised diagramming tool with many organisational chart templates, collaborative, cloud-based
- Miro: Well-suited for remote teams, intuitive and flexible, also for agile structures
- Microsoft Visio: Professional and powerful, well-integrated in Microsoft 365 environments
- PowerPoint / Excel: Sufficient for small companies or simple structures – less effort to create, but harder to maintain
- HR software (e.g. Personio, BambooHR): Organisational charts are generated automatically from personnel data and update themselves when changes occur – the most convenient solution for growing companies
Step 3: Build and Validate
Start with the executive leadership or board (top-down approach) and work your way through the levels. Have the completed chart reviewed by managers before publishing it.
Keeping Your Organisational Chart Up to Date: Best Practices
An outdated organisational chart is worse than none at all – it creates confusion and erodes trust. The following practices will help you maintain currency:
- Trigger-based updates: Whenever a position is newly filled, someone leaves the company, or a restructuring takes place, the chart is updated immediately.
- Bi-annual review: Even without major changes, a regular check is recommended – ideally anchored in the HR calendar.
- Digital tools with data integration: HR software that automatically generates organisational charts from the personnel system solves the maintenance problem structurally.
- Remote and hybrid as a challenge: In hybrid working models, teams and responsibilities shift more frequently. Digital, cloud-based organisational chart tools are especially valuable here, as all stakeholders can access the current version at any time.
GDPR note: If your organisational chart contains names, photos, or other personal data, this constitutes the processing of personal data under the GDPR. For internal use, this is generally unproblematic – for external publication (e.g. on the company website), you should obtain the consent of the individuals concerned or seek legal advice.
Frequently Asked Questions About Organisational Charts
What is an organisational chart?
An organisational chart is a visual representation of a company's organisational structure. It shows hierarchies, reporting lines, and departmental structures at a glance. The term derives from the Greek organon (tool) and gramma (writing/sign).
What types of organisational charts are there?
The main types are: line organisation (clear hierarchy, one manager per employee), line-and-staff organisation (line hierarchy supplemented by advisory staff positions), matrix organisation (dual reporting: department + project), divisional organisation (structured by products, regions, or markets), and flat and agile structures with few hierarchical levels.
What is the difference between an organisational chart and a staffing plan?
The organisational chart visualises structures and reporting lines – it shows who reports to whom. The staffing plan, by contrast, lists all planned and filled positions in tabular form, including details such as full-time equivalents or pay grades. Both documents complement each other but do not replace one another.
How do I create an organisational chart?
First, define your hierarchical levels and departments. Capture all relevant roles and reporting lines. Then choose an appropriate tool (e.g. Lucidchart, Miro, Visio, or your HR software). Build the chart top-down and have it reviewed by managers before publishing.
Which tool is best for creating one?
This depends on company size and requirements. For small companies, PowerPoint or Excel is often sufficient. Growing companies benefit from specialised tools such as Lucidchart or Miro. The most convenient solution: HR software like Personio or BambooHR, which automatically generates organisational charts from personnel data.
How often should an organisational chart be updated?
Immediately after any relevant personnel change or restructuring. In addition, a bi-annual review is recommended. In rapidly growing companies or those with frequent personnel changes, integration with HR software that updates automatically is advisable.
From what company size is an organisational chart worthwhile?
An organisational chart is recommended from around 10–15 employees. From approximately 50 people, it is virtually indispensable for ensuring orientation and transparency. Even start-ups with flat structures benefit from documenting their organisation, at least in a simple diagram.
May an organisational chart with names be published externally?
Names are personal data and therefore fall under GDPR regulations. For internal use, this is generally unproblematic. For external publication – such as on the company website – obtaining the consent of the individuals involved is recommended. When in doubt, legal advice is worthwhile.
Conclusion
An organisational chart is far more than a diagram – it is a strategic tool for transparency, communication, and workforce planning. Whether a line organisation, matrix structure, or agile network: the right type depends on company size, industry, and the culture that is actually lived. What matters most is that the chart is kept up to date and made accessible to all employees – particularly in hybrid working environments, this is not a nice-to-have but a basic prerequisite for smooth collaboration.
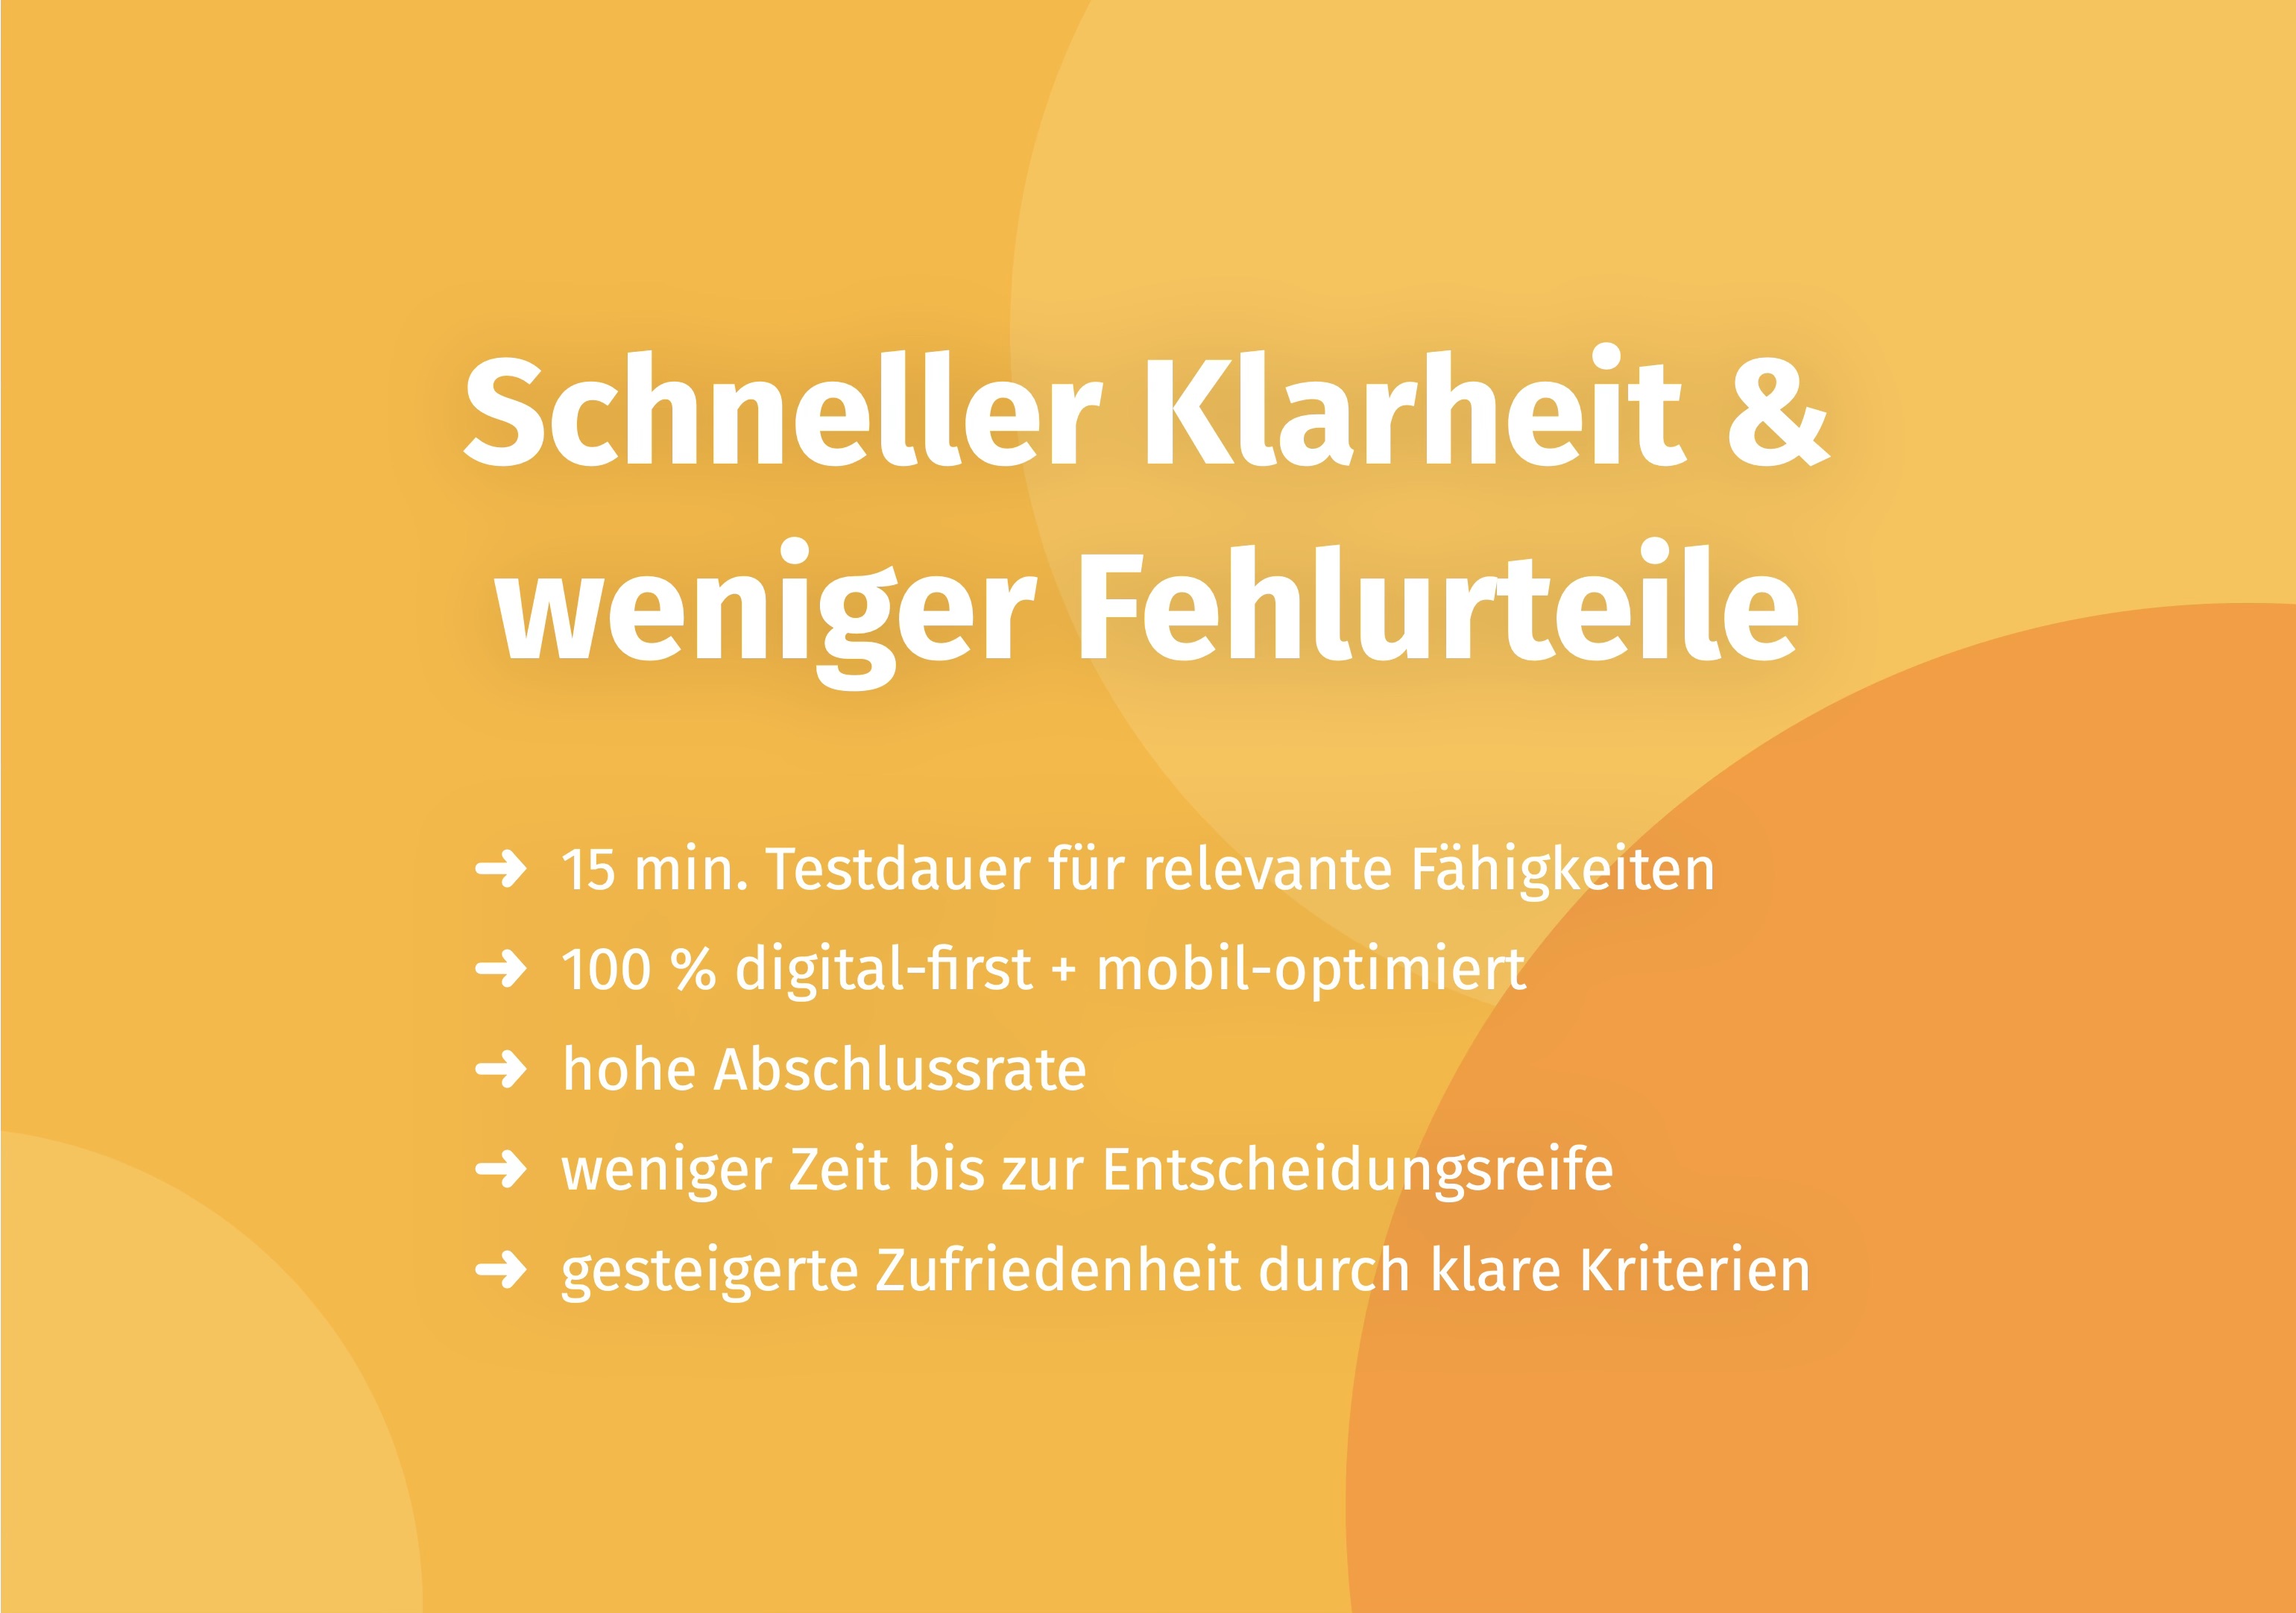
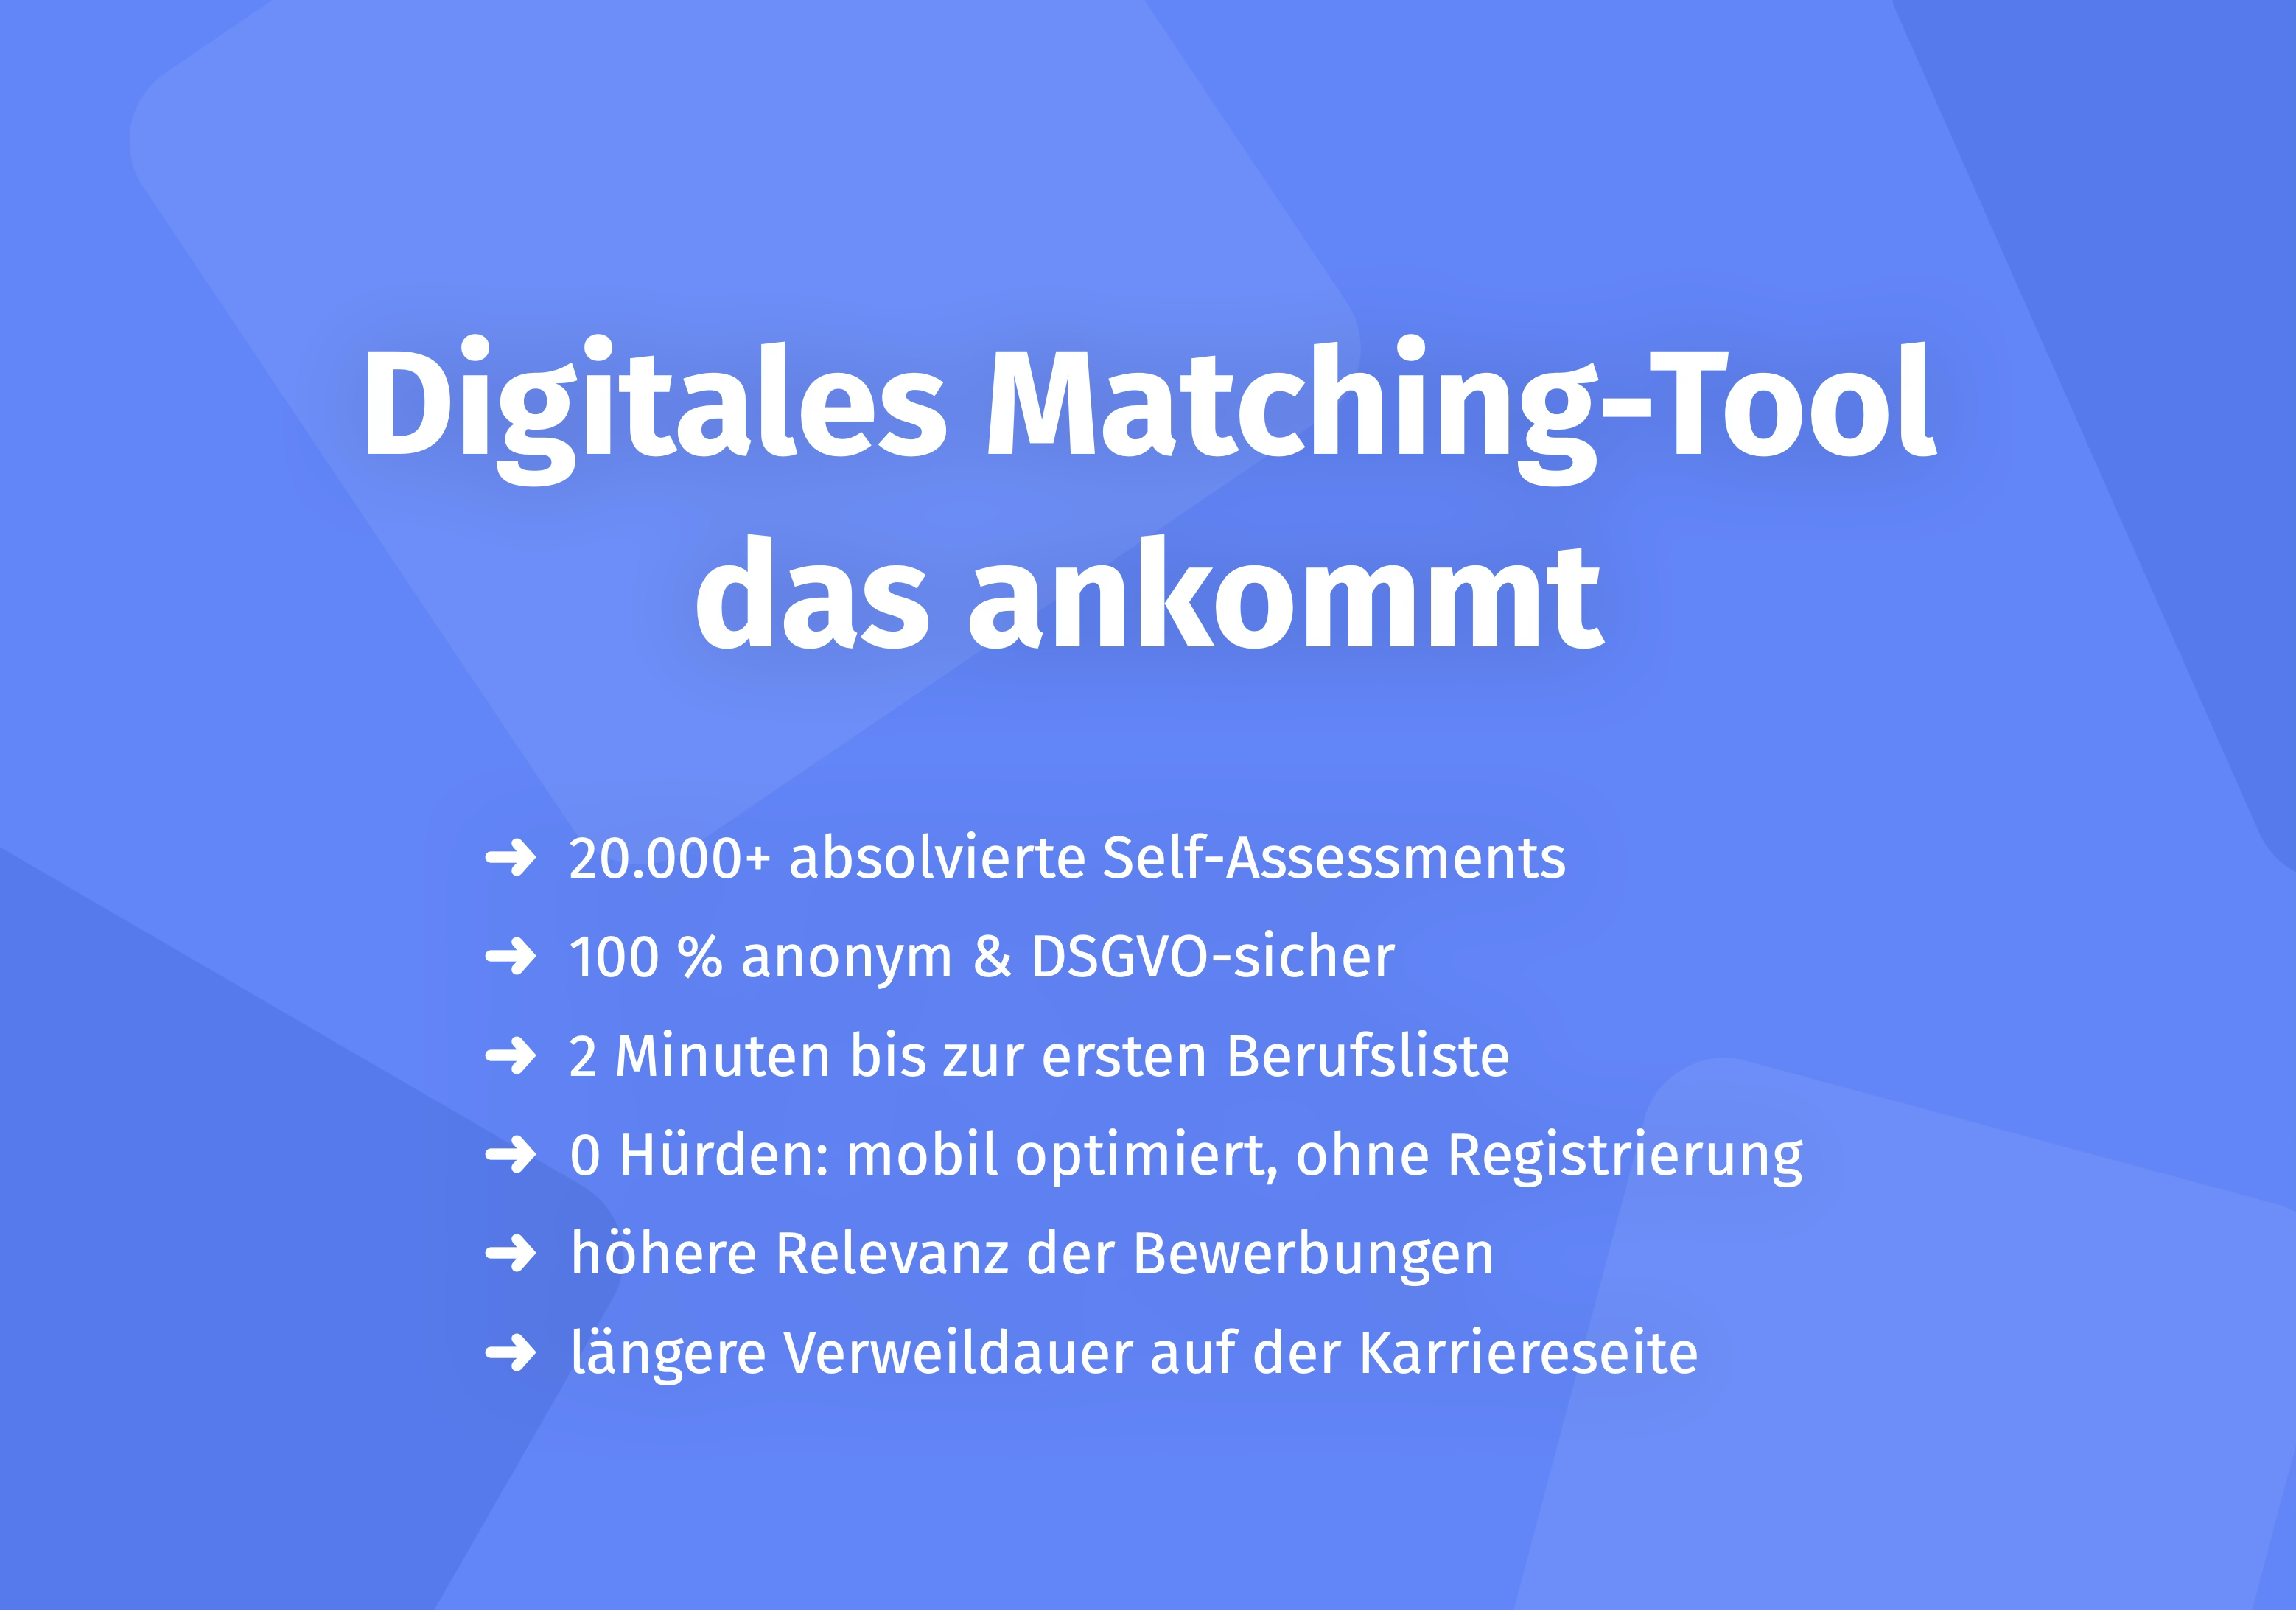
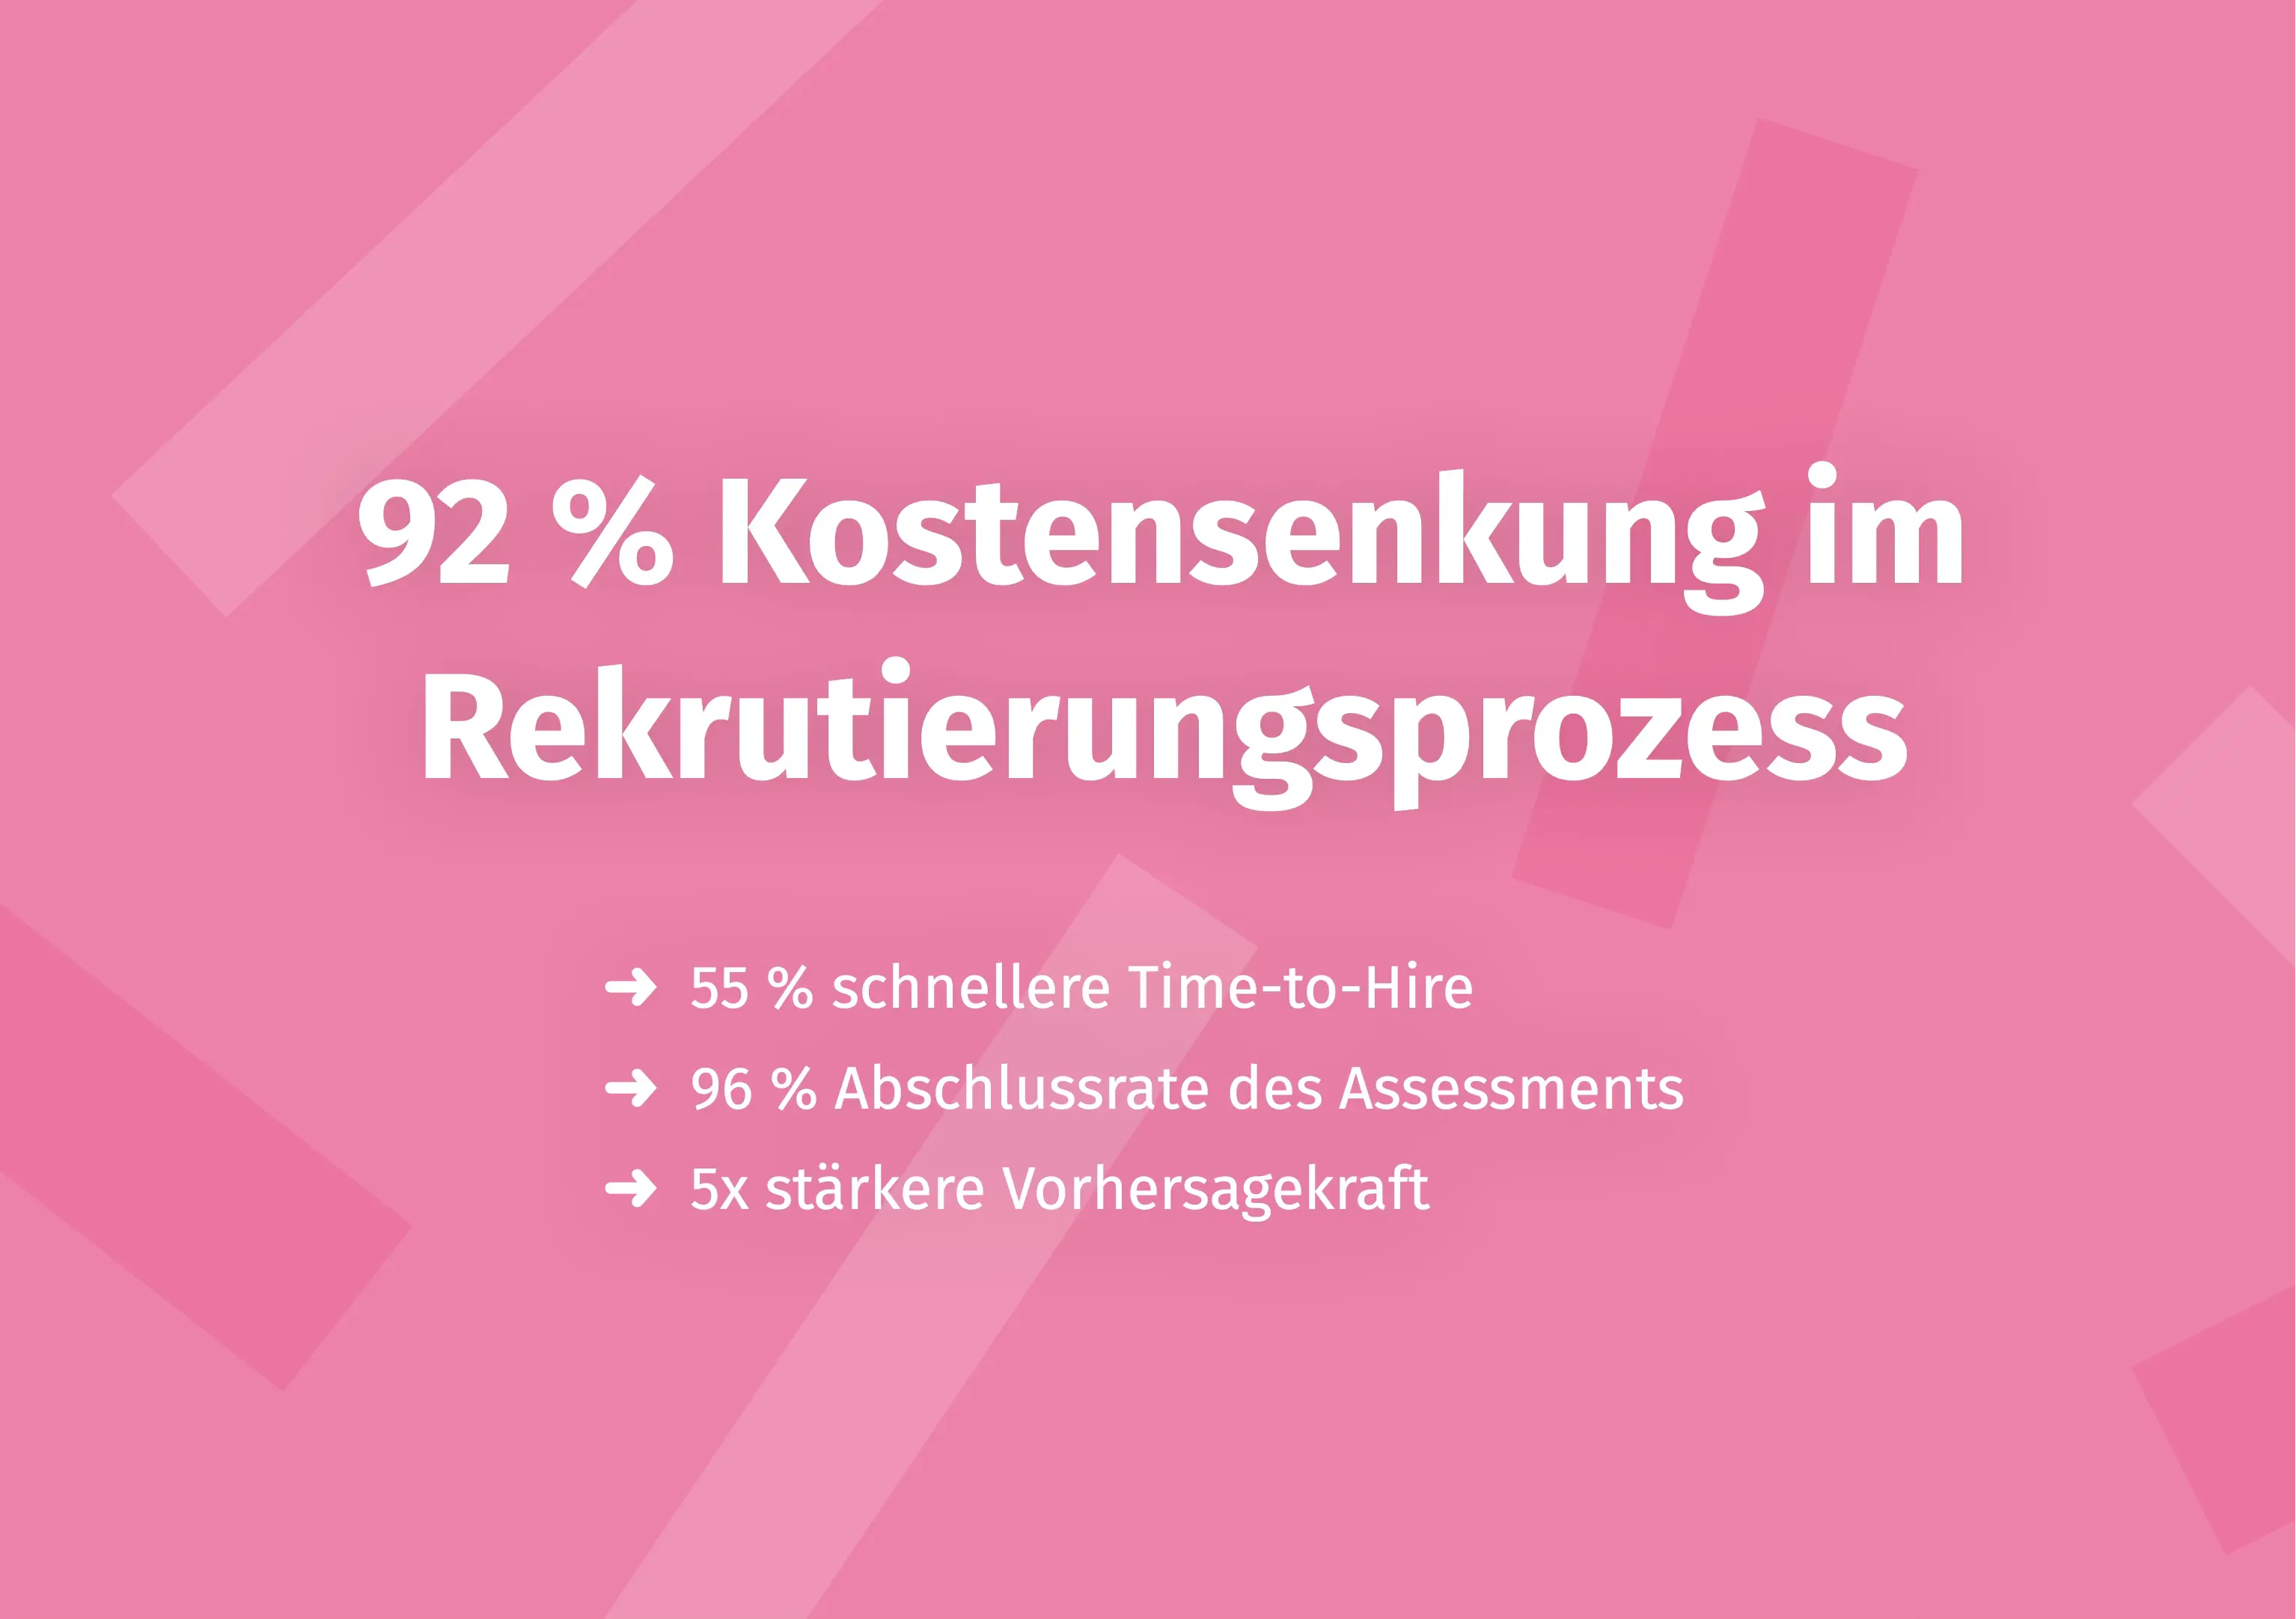
When new positions emerge in your organisational chart and need to be filled, the digital aptitude diagnostics platform Aivy supports you in selecting the right candidates objectively and fairly – scientifically grounded and free from unconscious bias.
Sources
- Bea, F.X. & Göbel, E.: Allgemeine Betriebswirtschaftslehre. Schäffer-Poeschel Verlag, 2019.
- Schreyögg, G. & Geiger, D.: Organisation. Grundlagen moderner Organisationsgestaltung. 6th edition. Springer Gabler, 2016.
- Mintzberg, Henry: The Structuring of Organizations. Prentice Hall, 1979.
- Personio GmbH: HR Lexicon – Organigramm, 2024. https://www.personio.de/hr-lexikon/organigramm/
- Lucidchart: What Is an Org Chart?, 2024. https://www.lucidchart.com/pages/what-is-an-org-chart

Make a better pre-selection — even before the first interview
In just a few minutes, Aivy shows you which candidates really fit the role. Beyond resumes based on strengths.