You invest time, money, and energy into recruiting – but do you really know if it's paying off? Many HR professionals know the feeling of recruiting "blind." Leadership asks for numbers, but all you have is gut instinct.
The good news: With the right recruiting KPIs, you can not only make your talent acquisition measurable but also systematically optimize it. Current research shows that companies with data-driven recruiting find the right talent faster while saving costs.
In this guide, you'll learn which recruiting metrics really matter, how to calculate them, and – most importantly – how to concretely improve them. We draw on current research findings and show you through real-world examples how other companies have optimized their KPIs.
What Are Recruiting KPIs and Why Do They Matter?
Definition: KPIs vs. Metrics vs. Data Points
Before diving into the details, let's clarify the terminology: KPI stands for Key Performance Indicator. In recruiting, KPIs are measurable values that evaluate the success of your talent acquisition and directly contribute to your strategic goals.
The difference from general metrics? Metrics are raw data points without context – such as the number of applications received. Recruiting KPIs, on the other hand, put this data in relation to your goals: How many of these applications actually led to hires? And at what cost?
An important distinction is also between quantitative and qualitative KPIs:
Why Data-Driven Recruiting Creates Competitive Advantages
In a VONQ study, 61% of surveyed recruiters reported difficulties finding suitable candidates. At the same time, 47% considered recruiting analytics increasingly important – but only 7% were actually well-positioned in this area.
This gap is your opportunity: Those who manage their recruiting processes with KPIs can:
- Deploy resources more efficiently: You know which channels work and which don't
- Better justify budgets: Concrete numbers convince leadership
- Identify problems early: Rising Time-to-Hire? You'll see it immediately
- Increase quality: Not just faster recruiting, but better recruiting
The Current State in Companies
The Recruiting Structures Benchmark Study 2025 by DGFP, HTWK Leipzig, and Wollmilchsau GmbH provides interesting insights: 65% of surveyed companies now work with independent recruiting units. 74% track Time-to-Hire – but only 9% measure Cost-of-Vacancy, the cost of an unfilled position.
This shows: Many metrics still have untapped potential. Qualitative KPIs like Quality of Hire are particularly often neglected.
The Most Important Recruiting KPIs at a Glance
Time-Based KPIs: Time-to-Hire, Time-to-Fill, Time-to-Interview
Time-to-Hire is probably the best-known recruiting metric. It measures the time from receiving an application to contract signing. The industry average is around 40 days; tech companies often achieve 30 days or less.
The formula is simple:
Time-to-Hire = Date of Contract Signing − Date of Application Receipt
Time-to-Fill goes one step further and covers the entire process – from the internal staffing request to filling the position. This metric is particularly important when you want to optimize the planning phase before posting.
Time-to-Interview measures how quickly you invite applicants to their first interview. This metric directly impacts the Candidate Experience: Long wait times lead to dropouts.
Cost-Based KPIs: Cost-per-Hire, Cost-per-Application, Cost of Vacancy
Cost-per-Hire shows you how much each new hire costs on average. The calculation:
Cost-per-Hire = (Internal Costs + External Costs) ÷ Number of Hires
Internal costs include recruiter personnel costs, hiring manager interview time, and software licenses. External costs cover job postings, recruiters, and employer branding activities.
The average Cost-per-Hire for skilled workers typically ranges between €3,000 and €7,000 (approximately $3,300 to $7,700). For IT specialists or executives, it can be significantly higher.
Cost-per-Application helps you understand how expensive each individual application is – regardless of whether it leads to a hire.
Cost of Vacancy is an often overlooked but important metric: It quantifies what an unfilled position costs you per day – through lost revenue, team overload, and productivity loss. For a position with an annual salary of €60,000, the Cost of Vacancy can be between €200 and €500 per day.
Quality-Based KPIs: Quality of Hire, Offer Acceptance Rate, Retention Rate
Quality of Hire is perhaps the most important – and simultaneously most difficult to measure – metric. It evaluates how well new employees fit the position and the company.
Since there's no universal formula, companies define their own criteria:
- Performance reviews after 6-12 months
- Retention in the company (Retention Rate after probation)
- Hiring manager feedback
- Goal achievement during onboarding
Offer Acceptance Rate shows how many candidates accept your job offer. A low rate indicates problems in the selection process or unattractive conditions.
Retention Rate measures how many new hires are still with the company after a certain period – a strong indicator of Quality of Hire.
Effectiveness KPIs: Channel Effectiveness, Candidate Experience, Application Drop-off Rate
Channel Effectiveness answers a central question: Which recruiting channels deliver the best results? It's not just about the number of applications, but also their quality.
An example: LinkedIn might only bring 30% of all applications, but 50% of ultimately hired candidates. That makes the channel very effective – and justifies higher investments.
The Application Drop-off Rate shows how many applicants abandon the process before completing it. A high rate indicates overly complicated forms or processes that are too long.
How to Calculate the Most Important Recruiting Metrics
Formulas and Calculation Examples
Here are the most important formulas at a glance:
What Data You Need and Where to Find It
For meaningful KPIs, you need a solid data foundation. The most important sources:
- Applicant Tracking System (ATS): Time-to-Hire, applicant numbers, channel attribution
- Accounting: Costs for postings, recruiters, software
- HR Department: Personnel costs, interview times
- Surveys: Candidate Experience, Hiring Manager Satisfaction
According to the Recruiting Structures Benchmark Study 2023, 13% of companies use their KPIs weekly for reporting, 28% monthly, and 18% quarterly. For operational management, monthly evaluation is recommended; for strategic adjustments, quarterly.
Avoiding Common Mistakes in KPI Calculation
Mistake 1: Comparing apples to orangesOnly compare your numbers with similar positions. The Time-to-Hire for an assistant position isn't comparable to that of an IT architect.
Mistake 2: Prioritizing quantity over qualityA low Time-to-Hire is useless if Quality of Hire suffers. Always consider KPIs in context.
Mistake 3: Viewing data in isolationChannel Effectiveness alone says little. Combine it with Quality of Hire: Which channel brings not just many, but also suitable applicants?
Quality of Hire: The Underrated Metric
Why Efficiency Alone Isn't Enough
Time-to-Hire and Cost-per-Hire are important – but they only measure efficiency. What good is it to hire quickly and cheaply if the person leaves after three months or doesn't perform?
Quality of Hire connects recruiting with business success. Research shows: Up to 25% of employment relationships fail during the probation period. This means: Many companies are optimizing the wrong KPIs.
HR professionals are increasingly focusing on this metric, but measurement remains a challenge. Why? Because it encompasses qualitative factors and only becomes meaningful after an onboarding period.
How to Measure Hiring Quality
Since there's no universal formula, here's a practical approach:
Step 1: Define 3-5 measurable criteria
- Performance rating after 6 months (scale 1-10)
- Goal achievement during onboarding (%)
- Retention after probation (yes/no)
- Hiring manager satisfaction (scale 1-10)
Step 2: Weight the criteria by relevance
Step 3: Calculate the average
Quality of Hire = (Criterion 1 + Criterion 2 + ... ) ÷ Number of Criteria
The Connection Between Selection Method and Quality of Hire
This is where it gets interesting: Your choice of selection method directly impacts Quality of Hire. The meta-analysis by Schmidt and Hunter (1998) shows clear differences in the validity of various methods:
This means: With scientifically validated assessment methods, you make significantly better selection decisions than with gut feeling.
Improving KPIs: From Measurement to Optimization
Optimizing Time-Based KPIs (Without Sacrificing Quality)
Reducing Time-to-Hire is a common goal – but not at any cost. Here are proven measures that combine speed and quality:
1. Quick responses: Respond to applications within 48 hours. Long wait times are the most common criticism on review platforms.
2. Parallel instead of sequential processes: Instead of scheduling Interview → Test Task → Second Interview one after another, combine steps where possible.
3. Structured pre-selection: With validated assessent methods, you recognize faster who fits – and who doesn't.
4. Standardized decision processes: Clear criteria and fixed timelines for hiring decisions.
Reducing Costs Through Better Pre-Selection
Cost-per-Hire automatically decreases when you spend less time with unsuitable candidates. The lever lies in pre-selection.
Companies that rely on data-based pre-selection report significant efficiency gains. The reason: They conduct fewer but better interviews – and make informed decisions faster.
Increasing Quality of Hire with Objective Assessment
Here's where the biggest lever shows: Objective selection methods improve multiple KPIs simultaneously.
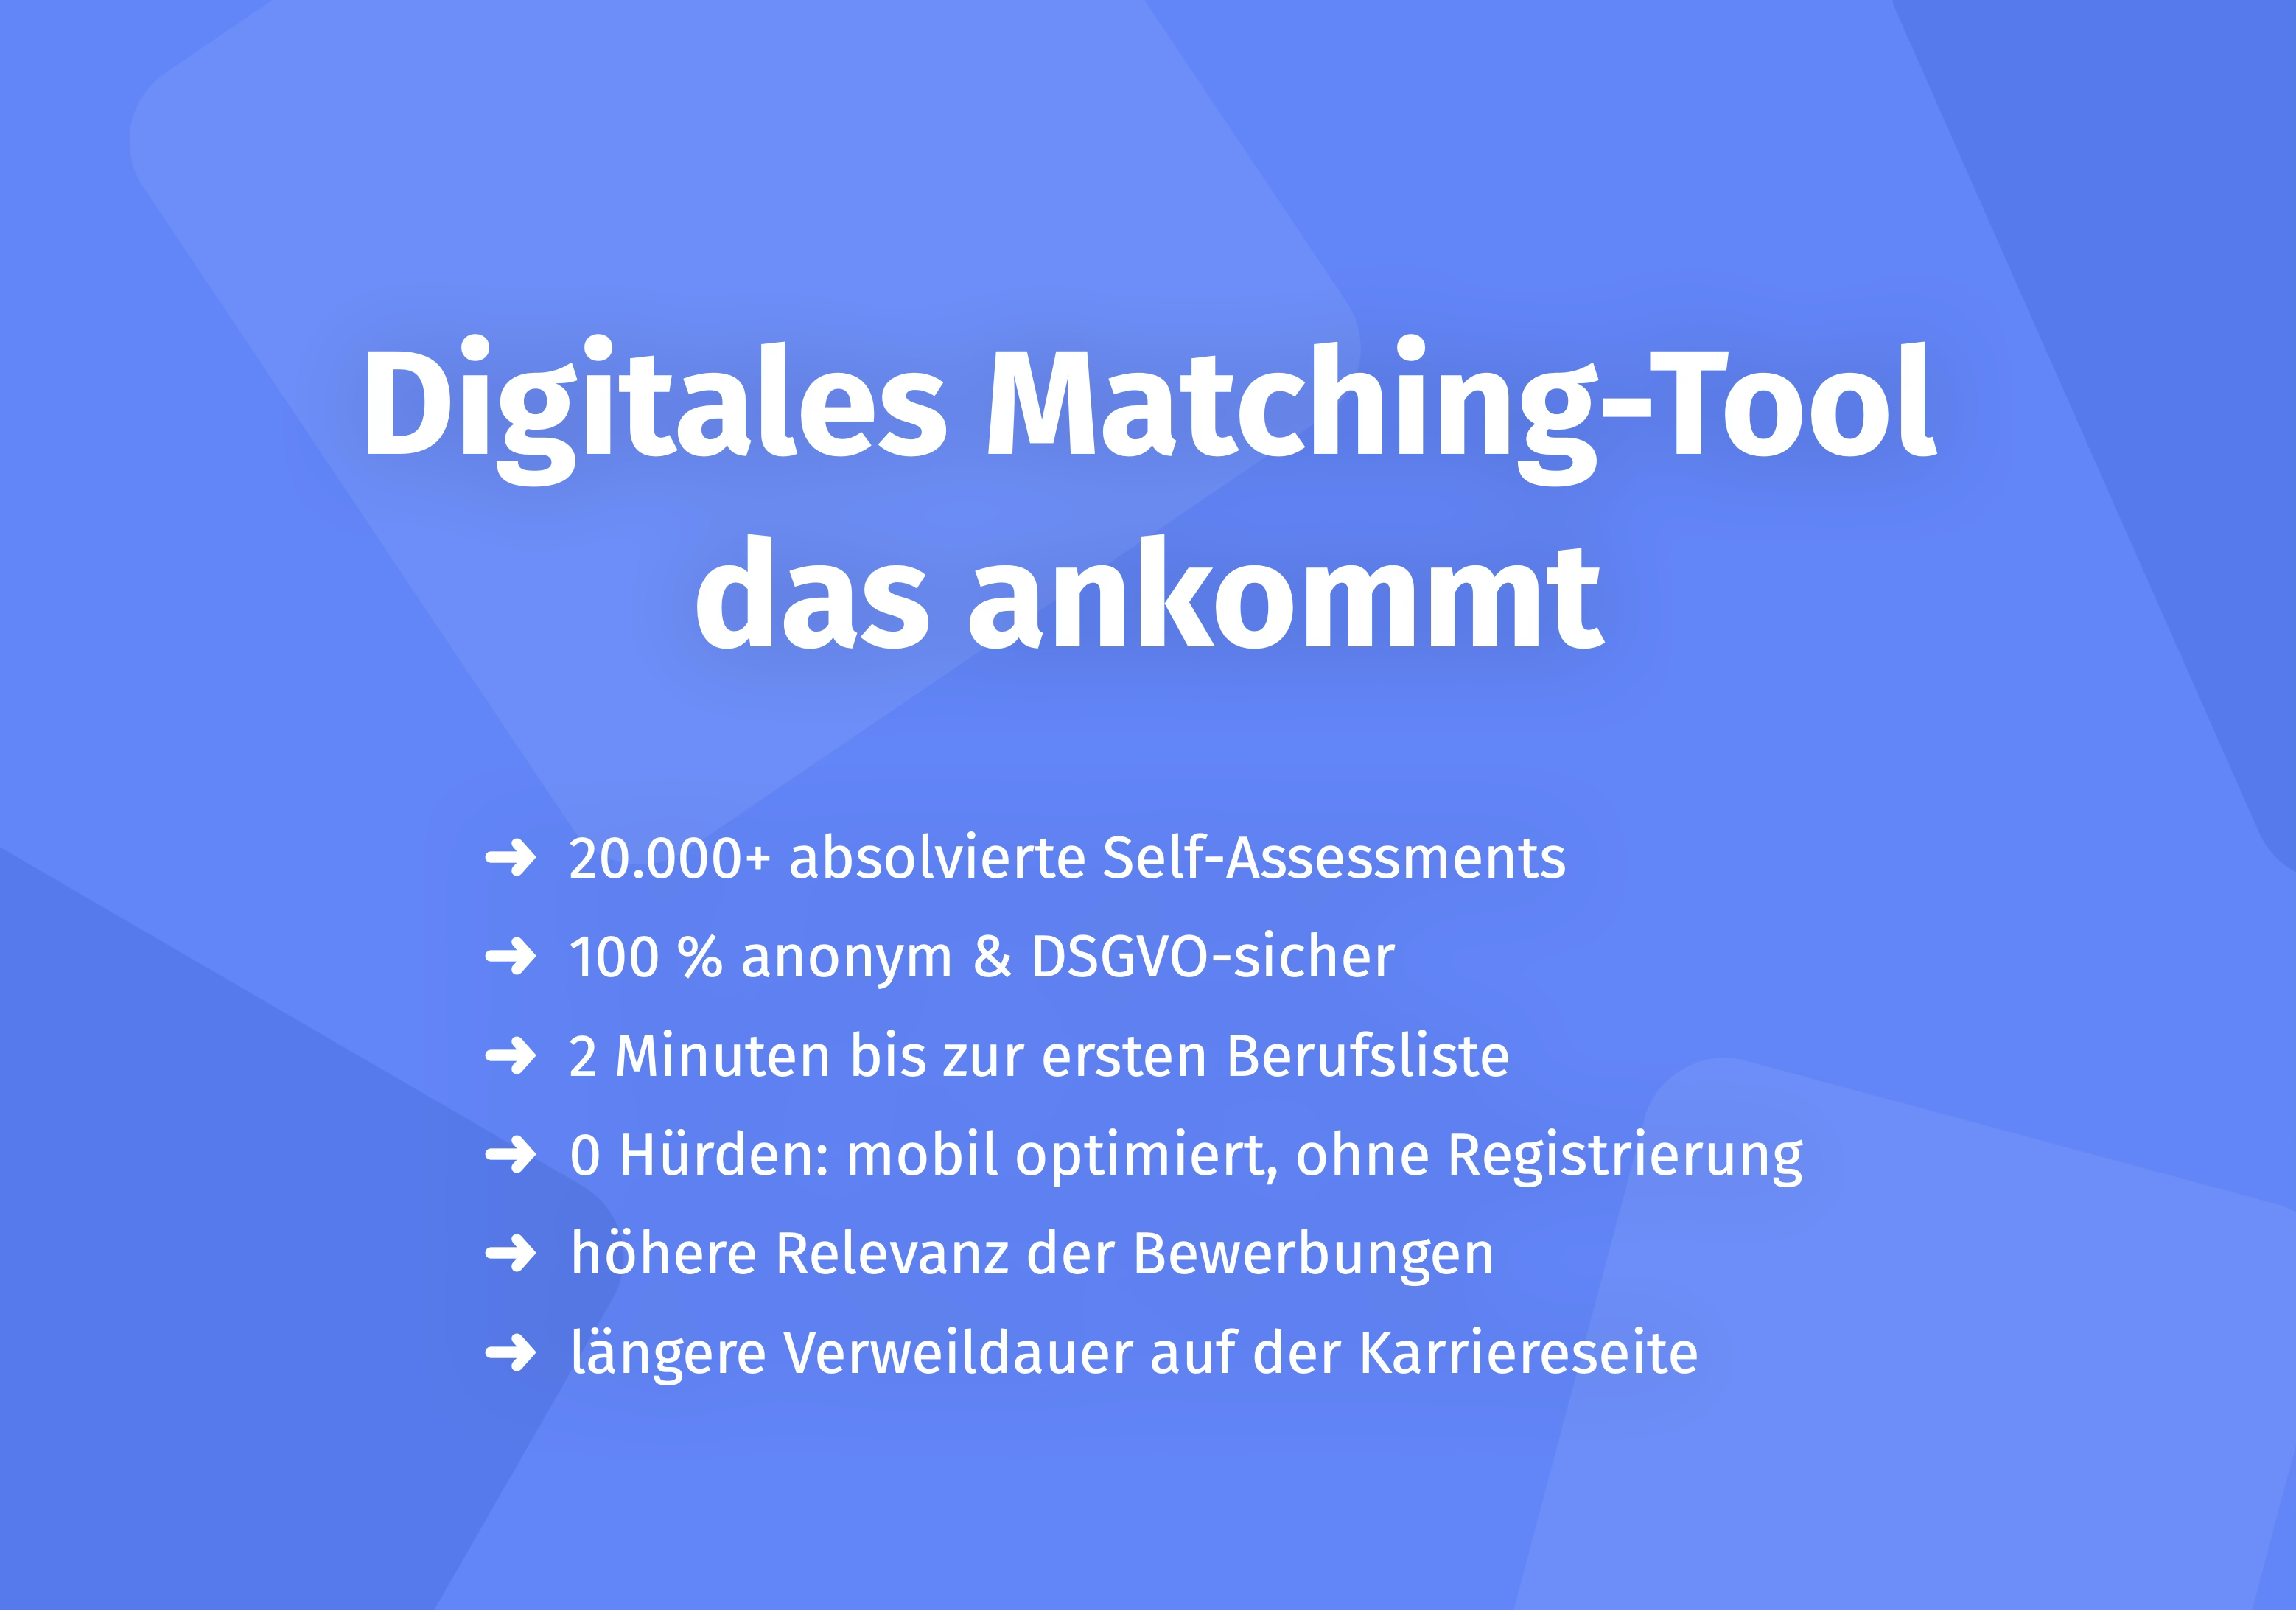
Tools like Aivy use scientifically validated game-based assessments that provide an objective data foundation. Instead of relying on resumes – which according to research say little about future performance – relevant competencies and potential are measured directly.
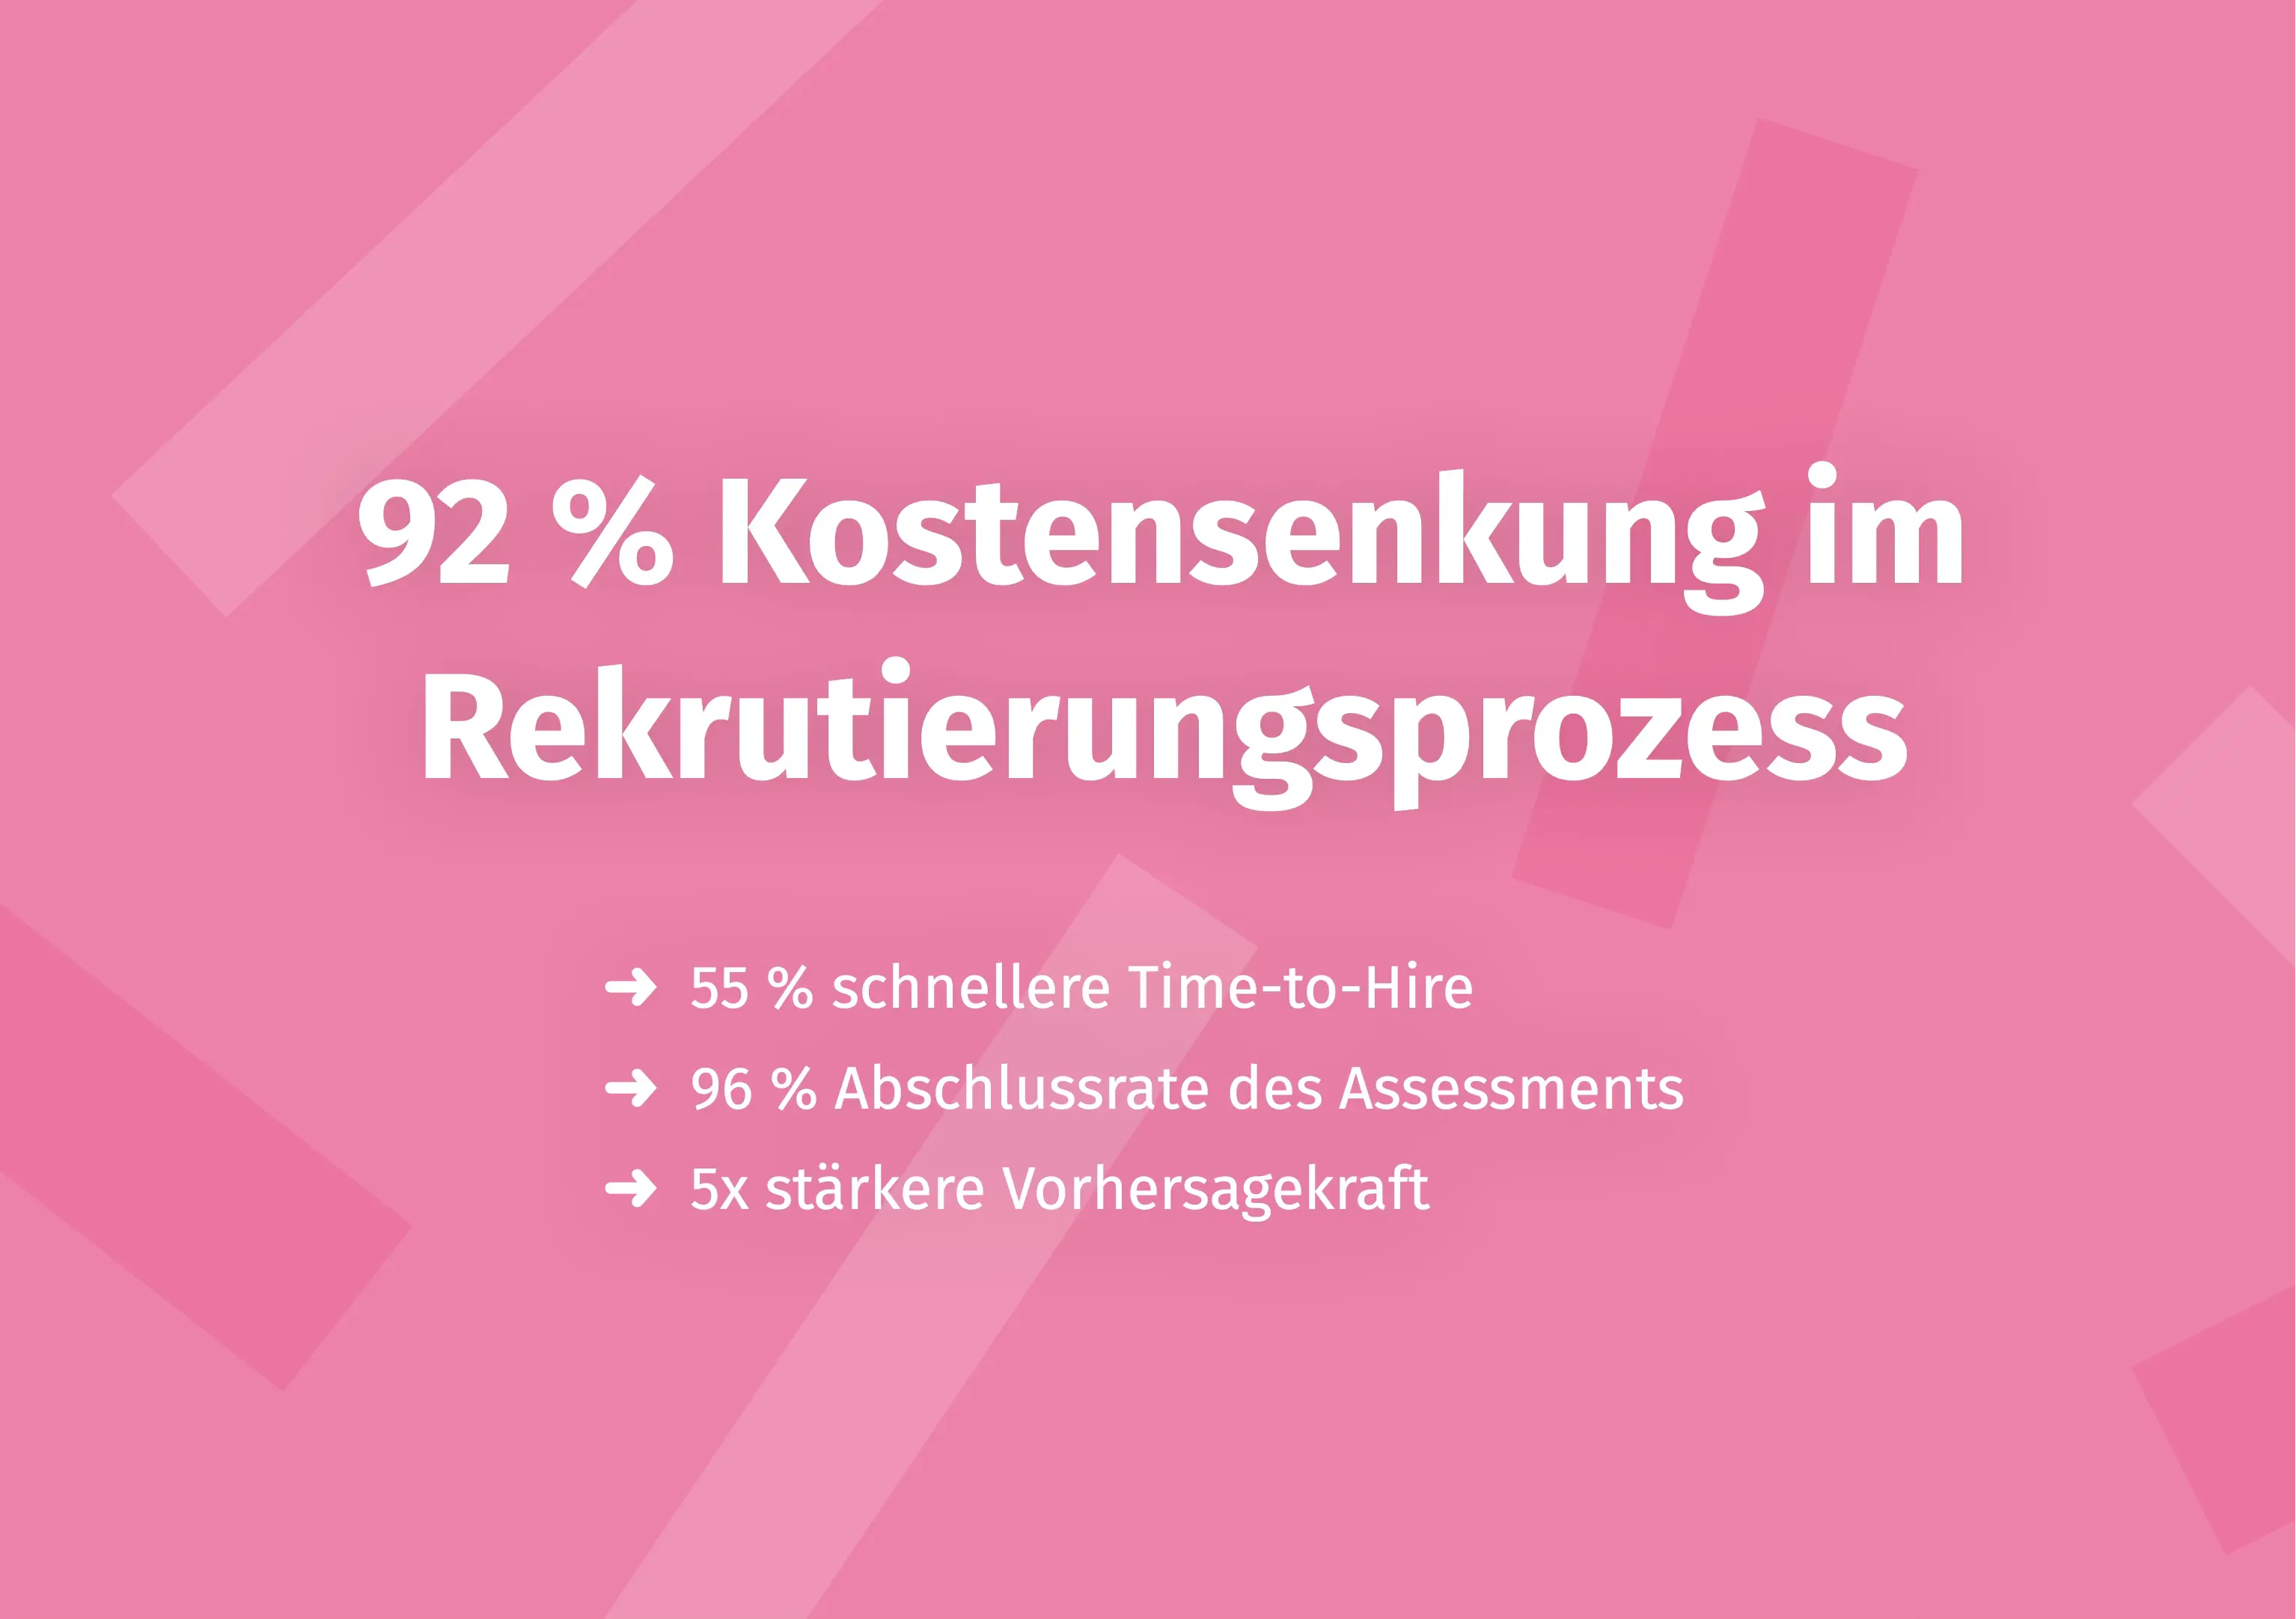
The results speak for themselves: MCI was able to reduce Time-to-Hire by 55% and simultaneously lower Cost-per-Hire by 92% through the use of game-based assessments. Matthias Kühne, Director People & Culture at MCI, highlights the "more objective evaluation basis" that has greatly professionalized the process.
Frankfurt School also reports measurable success: 30% fewer wrong decisions before the first interview and a 4x ROI in the first year.
Case Study: How Lufthansa Improved Their Recruiting KPIs
A particularly impressive example comes from Lufthansa. The airline uses objective assessment diagnostics to evaluate applicants fairly and efficiently – with impressive results:
- 96% accuracy rate (correct prediction vs. in-house assessment)
- 81% satisfaction among applicants
- 100+ minutes saved test time per applicant
- 86% completion rate in the assessment
Susanne Berthold-Neumann from Lufthansa explains the approach: "We look at the documents late because they only show a small part of the person and say little about whether someone has the competencies for future challenges."
More details can be found in the Lufthansa success story.
Building a Recruiting Dashboard: How to Get Started
The Right Selection: Less Is More (5-7 KPIs)
A common mistake: Tracking too many metrics at once. This leads to a lack of transparency and inability to act. Start with 5-7 KPIs that are truly relevant for your company.
Recommended Starter KPIs:
- Time-to-Hire (Efficiency)
- Cost-per-Hire (Costs)
- Quality of Hire (Quality)
- Channel Effectiveness (Channel Management)
- Offer Acceptance Rate (Attractiveness)
- Application Drop-off Rate (Process Quality)
Tools and Software for KPI Collection
Data collection doesn't have to be complicated. Modern applicant tracking systems track many KPIs automatically. Supplemented with HR analytics tools, you get dashboards at the click of a button.
Integration is key: Your ATS should work seamlessly with assessment tools and performance management systems. Only then can you establish the connection between recruiting data and later employee performance.
From Dashboard to Action: Interpreting Data Correctly
Metrics alone change nothing. The value lies in the conclusions:
Question 1: Which KPIs deviate from the target value?Question 2: What are possible causes?Question 3: What measures can we test?Question 4: How do we measure the success of the measures?
An example: Your Time-to-Hire is too high. Possible causes: Too long feedback loops with departments, too many interview rounds, slow pre-selection. Test one measure (e.g., structured pre-selection with online assessments) and measure the change.
Frequently Asked Questions (FAQ)
What are the 5 most important recruiting KPIs? The five most important KPIs are Time-to-Hire, Cost-per-Hire, Quality of Hire, Channel Effectiveness, and Offer Acceptance Rate. They cover efficiency, costs, quality, and process management.
How do you calculate Time-to-Hire? Time-to-Hire = Date of contract signing minus date of application receipt. Example: Application on March 1st, contract on April 20th = 50 days Time-to-Hire.
What's the difference between Time-to-Hire and Time-to-Fill? Time-to-Hire measures the time from application receipt to contract signing. Time-to-Fill covers the entire process from the staffing request to filling the position – including the planning and posting phase.
How do you measure Quality of Hire? Quality of Hire is measured through multiple factors: Performance reviews after 6-12 months, Retention Rate, Hiring Manager satisfaction, and cultural fit. Companies define their own criteria and rate them on a scale.
What are good benchmark values for Cost-per-Hire? The average Cost-per-Hire for skilled workers typically ranges between €3,000 and €7,000 (approximately $3,300-$7,700). For executive positions or IT specialists, it can be significantly higher.
How often should you evaluate recruiting KPIs? According to the DGFP study, 13% of companies use their KPIs weekly, 28% monthly, and 18% quarterly. For operational management, monthly evaluation is recommended; for strategic adjustments, quarterly.
How are recruiting KPIs connected to assessment diagnostics? Objective assessment diagnostics can improve multiple KPIs simultaneously: Time-to-Hire decreases through faster pre-selection, Quality of Hire increases through valid potential analysis, Cost-per-Hire decreases through fewer bad hires, and Candidate Experience improves through modern testing methods.
Conclusion: Achieving Recruiting Success with the Right KPIs
Recruiting KPIs are more than number games – they're your compass for better hiring decisions. The key takeaways:
- Start focused: 5-7 KPIs are enough for the beginning
- Maintain balance: Combine quantitative and qualitative metrics
- Prioritize Quality of Hire: Not just fast recruiting, but right recruiting
- Optimize data-driven: Test measures and measure results
- Question methods: The selection method directly impacts results
The key lies not just in measuring, but in targeted improvement. Objective assessment tools like Aivy can help optimize multiple KPIs simultaneously – from Time-to-Hire to Cost-per-Hire to Quality of Hire.
Your next step: Check which KPIs you're already collecting – and where the biggest gaps are. Research shows: Most companies have untapped potential, especially with qualitative metrics.
Sources
- Recruiting Structures Benchmark Study 2023/2025 – DGFP, HTWK Leipzig, Wollmilchsau GmbH
- Schmidt, F.L. & Hunter, J.E. (1998). The Validity and Utility of Selection Methods in Personnel Psychology. Psychological Bulletin, 124(2), 262-274.
- VONQ Study 2019: Recruiting Analytics in Practice
- Aivy Success Stories: MCI, Lufthansa, Frankfurt School

Make a better pre-selection — even before the first interview
In just a few minutes, Aivy shows you which candidates really fit the role. Beyond resumes based on strengths.