HR statistics are measurable indicators that make the success and efficiency of HR work visible – from time-to-hire to employee turnover. They form the foundation for data-driven decisions in HR, management, and workforce planning. The most important categories include recruiting metrics, retention KPIs, cost indicators, and engagement values.
What Are HR Statistics?
HR statistics – also referred to as HR metrics, HR KPIs, or people analytics data – are quantifiable measures that companies use to capture, evaluate, and manage the performance of their HR function. They transform subjective impressions into reliable facts: How long does it take to fill an open position? What percentage of the workforce leaves each year? How satisfied are employees with their work?
KPI vs. Metric: What's the Difference?
Although the terms are often used interchangeably, there is an important distinction: a metric is a general measurement that describes a situation – for example, the current time-to-hire. A KPI (Key Performance Indicator), on the other hand, is a strategically significant figure tied to a concrete target – such as "time-to-hire under 30 days by Q3". KPIs are therefore metrics with a goal orientation.
For HR professionals, the key takeaway is this: not every metric is a KPI. The skill lies in filtering from the wealth of available data the 5–10 figures that are truly decisive for the organisation.
Why Are HR Statistics Important?
Without reliable metrics, HR teams make decisions based on gut feeling – with the associated risks of bad hires, wasted recruiting budgets, and poor employee retention. HR statistics make it possible to identify problems early, demonstrate the impact of improvement measures, and communicate the value of HR work to senior leadership.
People Analytics – the systematic use of employee data to support decision-making – has established itself as a discipline in its own right in recent years and is becoming increasingly important for HR.
The Most Important HR Metrics at a Glance
Recruiting Statistics
Recruiting metrics measure the efficiency and quality of the hiring process.
Time-to-Hire refers to the period from first contact with a candidate to the signing of the employment contract. The shorter, the more efficient the process – and the lower the risk of losing candidates to faster competitors. According to the LinkedIn Talent Trends Report, the average in the DACH region was approximately 41 days.
Cost-per-Hire covers all internal and external costs incurred to fill a position: job boards, headhunter fees, HR staff time, and onboarding costs. The figure varies considerably by industry and role type – from a few hundred euros to several thousand euros for senior positions.
Offer Acceptance Rate shows what percentage of job offers made are actually accepted. A low rate may indicate unattractive salary offers, a poor candidate experience, or an overly lengthy process.
Application Rate indicates how many applications are received per advertised position – an important indicator of the company's attractiveness as an employer.
Retention Metrics
Employee Turnover Rate is one of the most widely used HR metrics. It shows what percentage of the workforce has left the organisation within a given period. The distinction between voluntary turnover (resignation) and involuntary turnover (dismissal) is critical for root cause analysis.
Tenure describes the average length of time employees remain with the organisation. A declining value is an early warning signal for retention issues.
Engagement & Satisfaction
eNPS (Employee Net Promoter Score) measures whether employees would recommend the company as an employer. The scale ranges from –100 to +100. Scores above 20 are considered good; above 50, excellent (Gallup).
Employee Satisfaction Index is typically gathered through regular staff surveys and provides insight into morale, motivation, and potential risk areas.
Costs & Performance
Personnel Cost Ratio sets total personnel costs in relation to revenue. It is an important management indicator for the leadership team.
Absenteeism Rate shows how many working days are lost to illness. According to the Federal Employment Agency (Bundesagentur für Arbeit), the average absenteeism rate in Germany has recently been around 5–6 percent – varying considerably by industry.
Training Cost per Employee indicates how much a company invests per employee in qualification and development – an important indicator of an organisation's commitment to growth.
How to Calculate HR Metrics Correctly
Formulas for the Most Common Metrics
Employee Turnover Rate:
(Number of departures in period ÷ Average number of employees) × 100
Example: 12 departures among 200 employees = 6% turnover
Cost-per-Hire:
(External recruiting costs + Internal recruiting costs) ÷ Number of hires
Internal costs include, for example, HR staff hours, hiring manager time, and onboarding effort.
eNPS:
% Promoters (score 9–10) minus % Detractors (score 0–6)
Passives (score 7–8) are not counted.
Absenteeism Rate:
(Days absent due to illness ÷ Target working days) × 100
Practical Calculation Examples
A mid-sized company with 150 employees records 18 departures in one year. The turnover rate is therefore (18 ÷ 150) × 100 = 12%. In industry comparison (retail: often 20–30%), this is a solid figure. Compared to IT companies (average approximately 15–20%), it is equally unremarkable.
HR Benchmarks in Germany
Without reference values, metrics say little on their own. The following overview provides orientation – concrete figures vary by industry, company size, and region.
Note: These figures are reference values. Industry-specific benchmarks may vary significantly.
Optimising Data-Driven Recruiting with HR Statistics
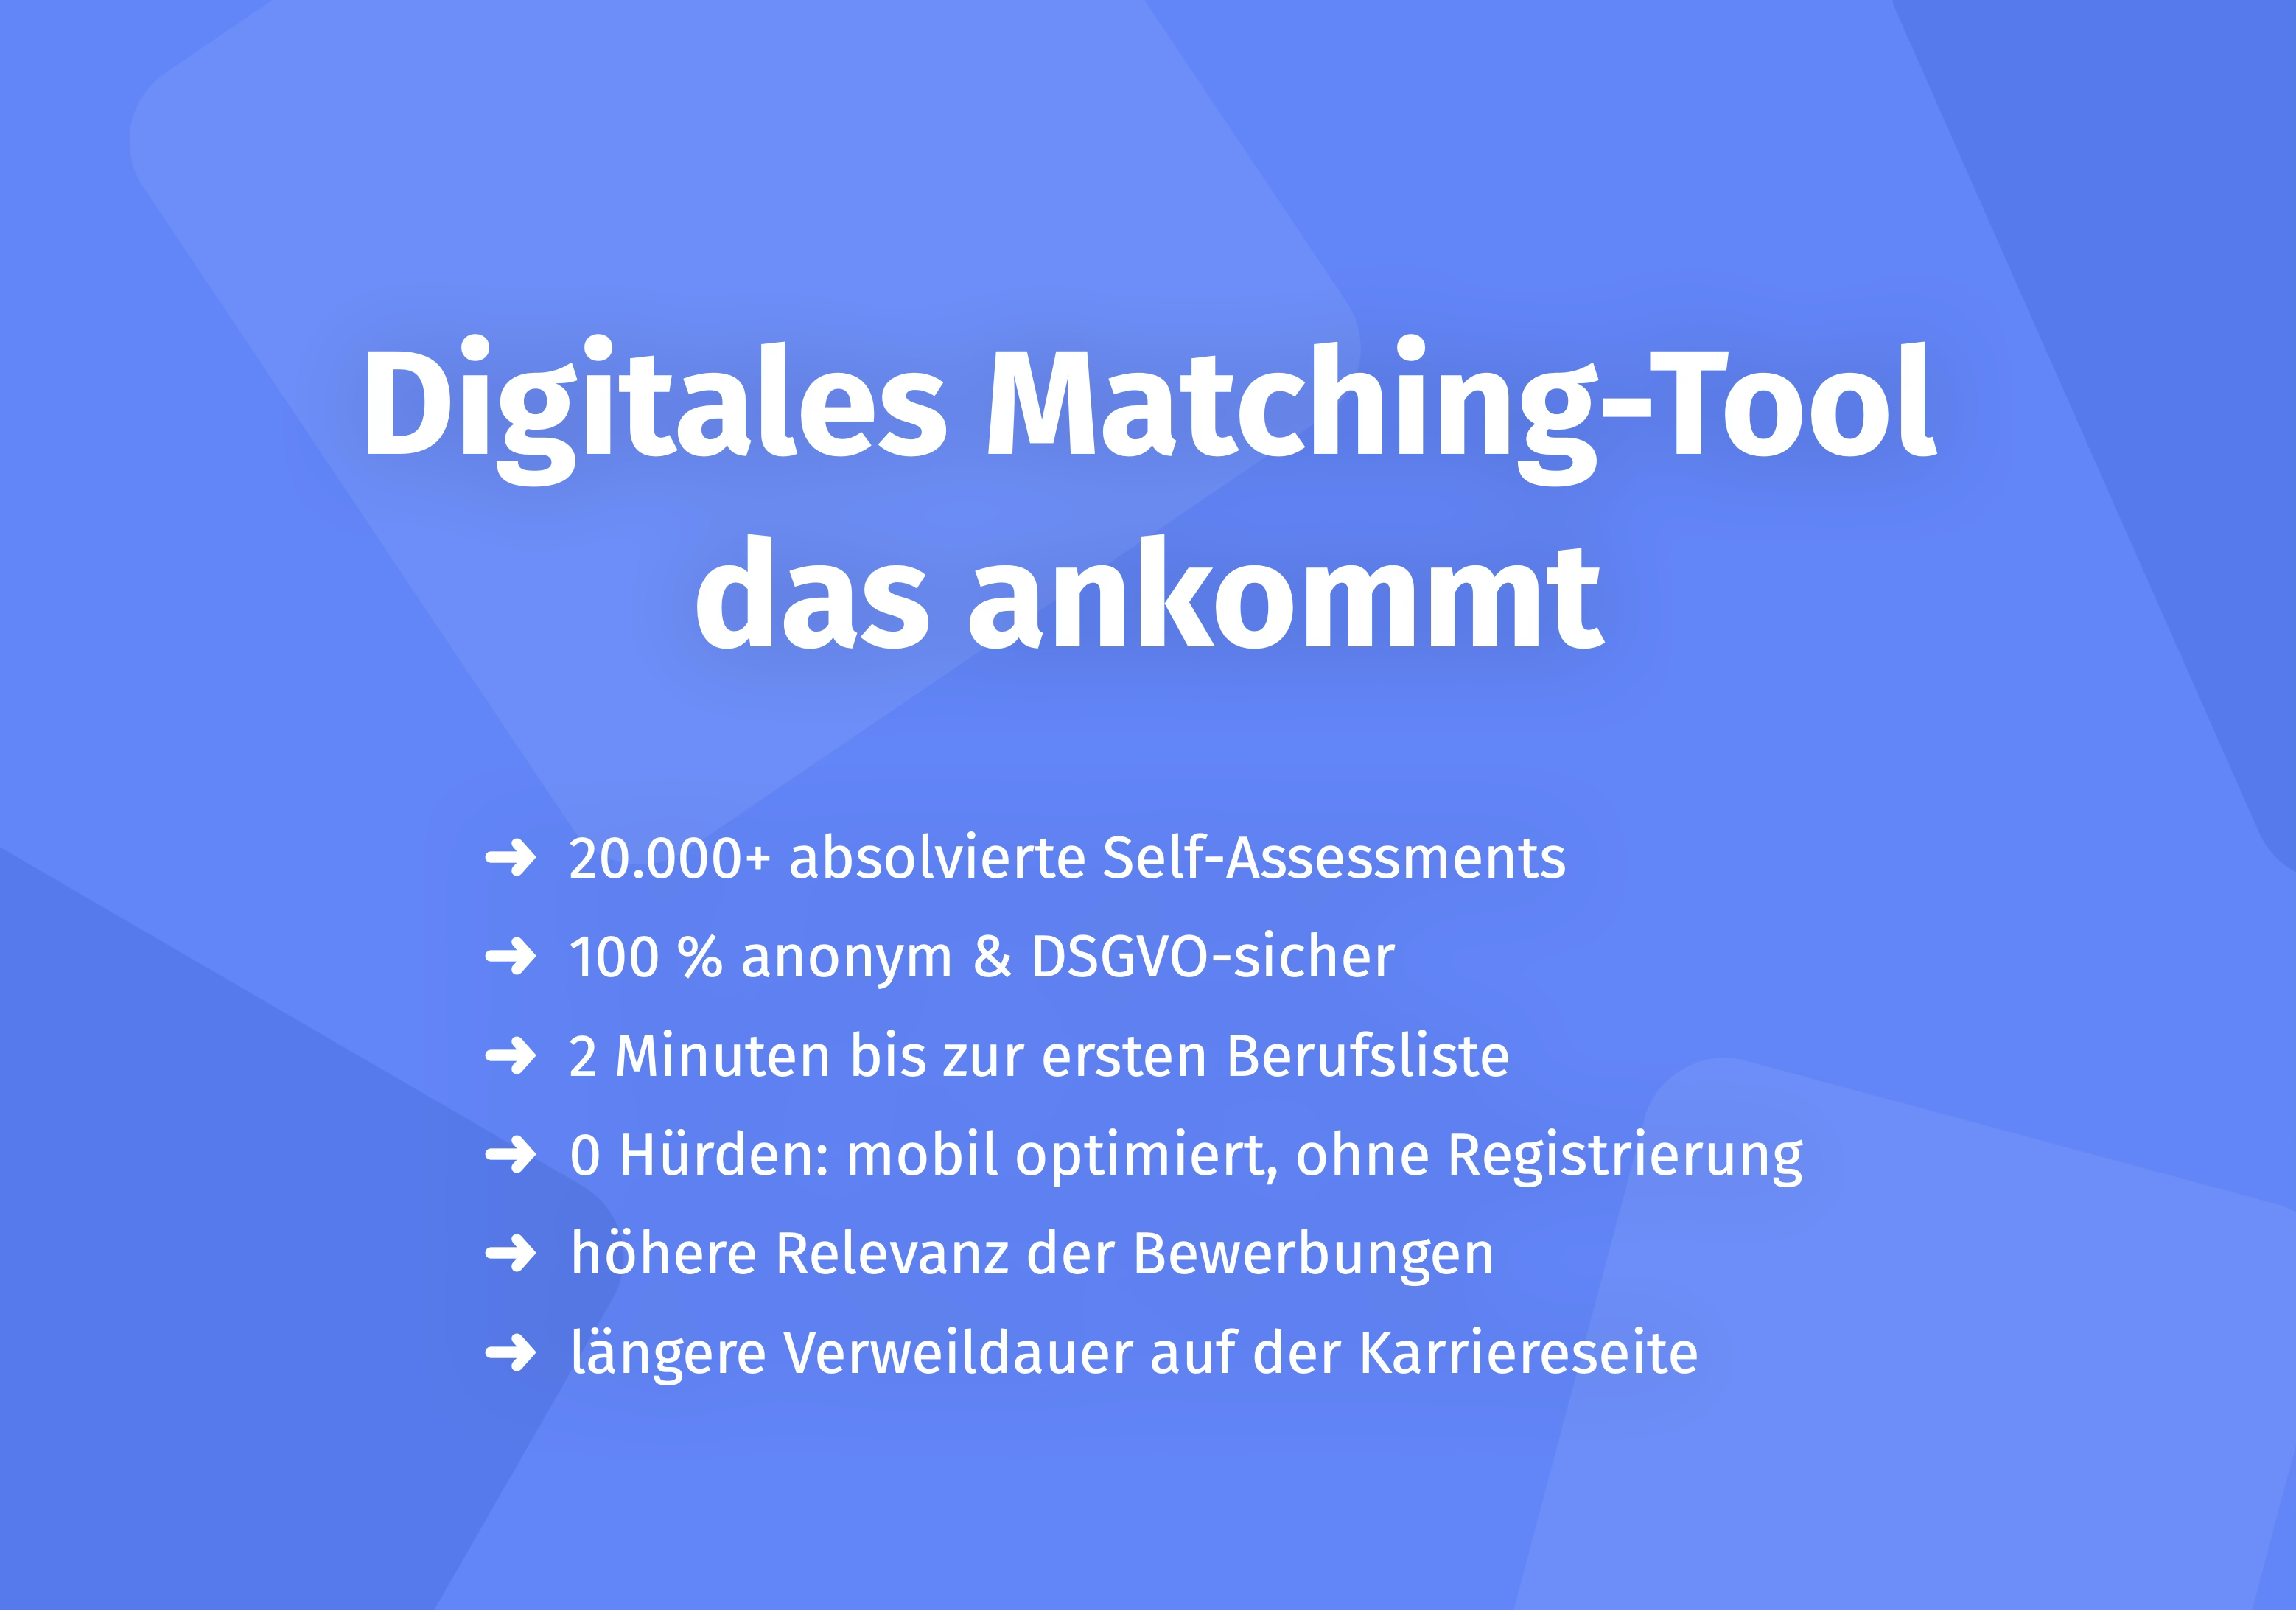
HR statistics deliver their greatest value when they are not merely measured, but actively used to optimise processes. Recruiting in particular holds considerable improvement potential: many companies lose strong candidates through overly long processes, poor candidate experience, or subjective selection decisions – without detecting it in their metrics.
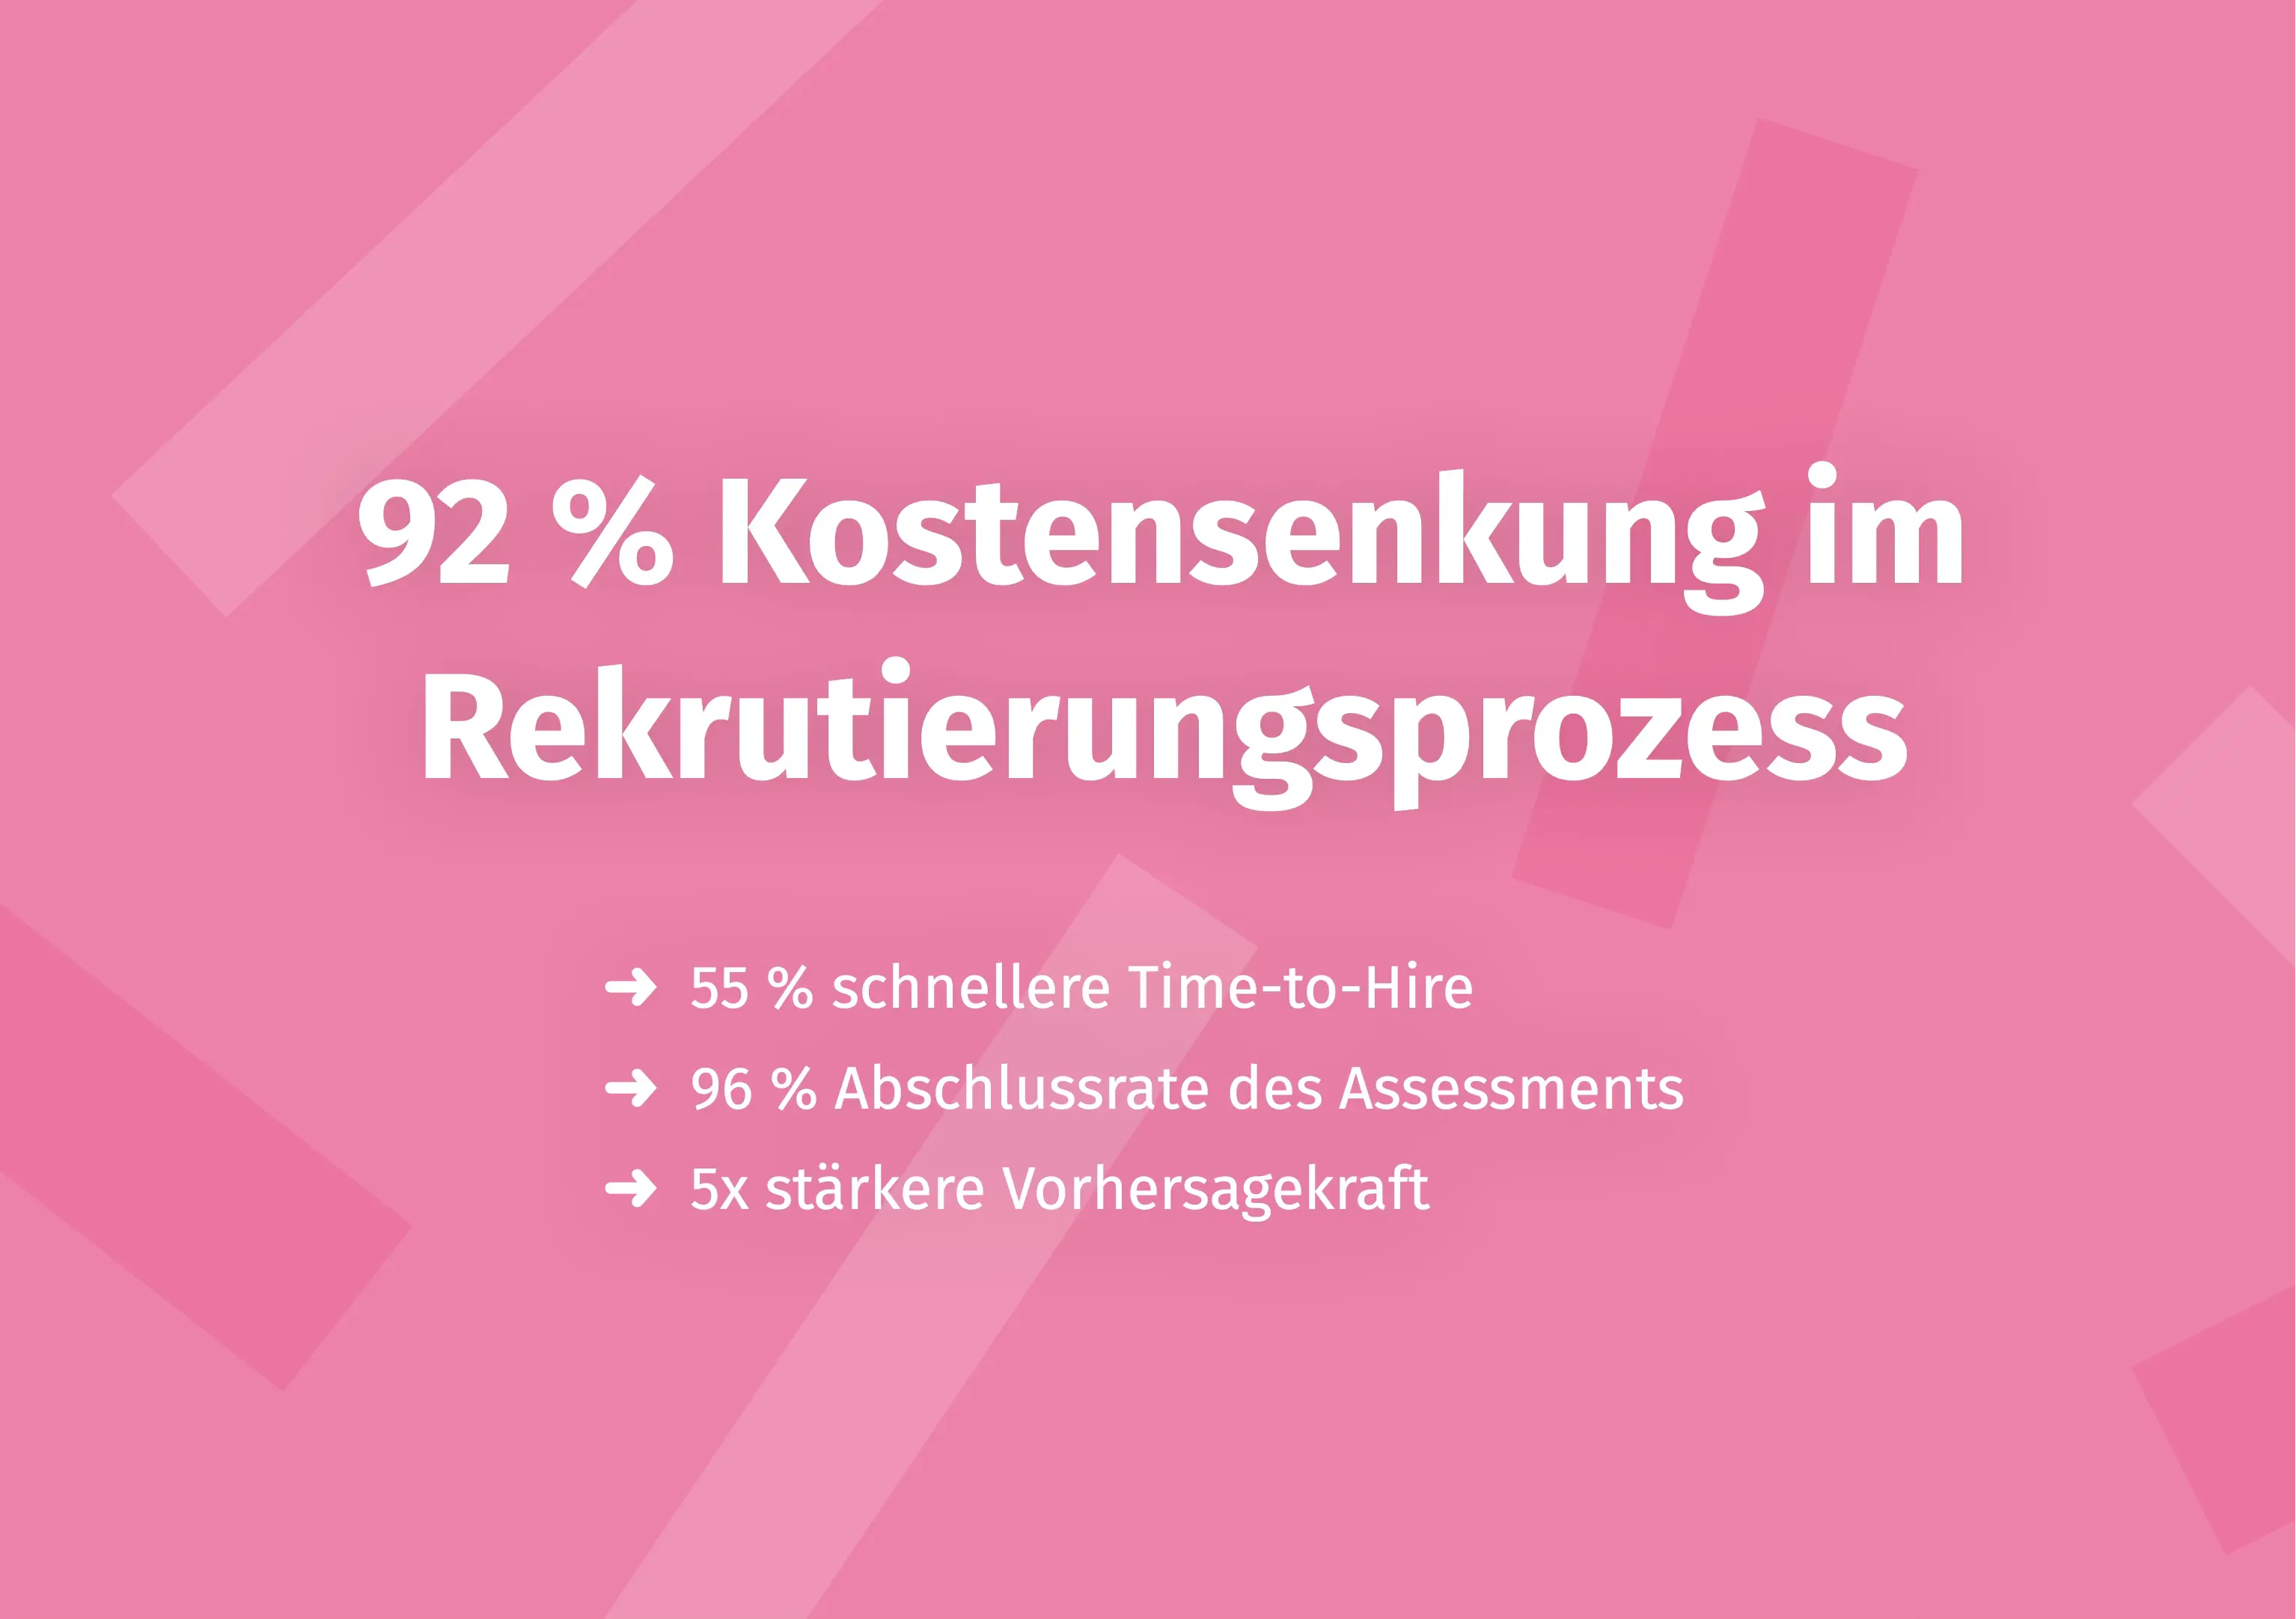
Objective aptitude assessment can play a central role here: when selection decisions are based on validated criteria rather than gut feeling, recruiting metrics improve measurably. MCI Deutschland, for instance, reduced its time-to-hire by 55% and its cost-per-hire by 92% through the use of scientifically grounded diagnostics. The Aivy platform supports HR teams in integrating aptitude assessment systematically and in compliance with GDPR into the recruiting process – as a scientific spin-off of Freie Universität Berlin with more than 100,000 assessments completed.
Further details are available in the MCI success story.
For those looking to manage HR statistics holistically beyond recruiting, further background is available in the glossary entries on HR Analytics and Potential Analysis.
Frequently Asked Questions About HR Statistics
What are HR statistics?
HR statistics are quantifiable metrics that make the performance and efficiency of HR work measurable. They help HR teams and leadership make well-founded decisions – from workforce planning to recruiting optimisation. The distinction between a metric (a general measure) and a KPI (a measure tied to a strategic target) is an important one.
Which HR metrics are the most important?
This depends on the organisation's goals. These core metrics have proven their value: time-to-hire and cost-per-hire for recruiting; turnover rate and tenure for employee retention; eNPS and satisfaction index for engagement; and absenteeism rate and personnel cost ratio for costs and performance. Not all metrics are equally relevant for every organisation – what matters is selecting the 5–10 most strategically significant KPIs.
How do I calculate the employee turnover rate?
Formula: (Number of departures ÷ Average number of employees) × 100. Important: voluntary and involuntary turnover should be reported separately, as they point to different areas for action. According to the DGFP, a cross-industry turnover rate of 15–25% p.a. is considered normal in Germany.
What is a good time-to-hire?
In the DACH region, the average is around 41 days according to the LinkedIn Talent Trends Report. For many companies, a target of under 30 days is ambitious but achievable – depending on industry, role type, and talent pool. An excessively long time-to-hire increases the risk of losing strong candidates.
What does a bad hire cost?
Estimates suggest that a bad hire costs between 30 and 150 percent of the annual salary for the role in question – depending on position, industry, and the duration of the misfit. These costs comprise direct costs (re-recruiting, onboarding) and indirect costs (loss of productivity, team strain, knowledge transfer). Robust selection processes therefore typically pay for themselves quickly.
What is the difference between an HR KPI and an HR metric?
A metric describes a situation in measurable terms – for example, a current turnover rate of 18%. A KPI ties the same measure to a strategic target: "Reduce turnover rate to below 15% by Q4". KPIs are thus metrics with goal-binding and serve active management, not just observation.
Which HR statistics does senior leadership need?
Leadership is primarily interested in metrics with cost and strategic relevance: personnel cost ratio, cost-per-hire, turnover rate, and eNPS. A compact HR dashboard with 5–7 top KPIs – each with a prior period and benchmark for comparison – is recommended. Crucially, metrics should be translated into business language: "Turnover is costing us X euros" rather than "Turnover stands at Y percent".
How do I measure employee satisfaction?
The most common methods are: regular employee surveys (annual or semi-annual), pulse surveys (short, frequent check-ins), the eNPS, and exit interviews with departing employees. What matters is not just the data collection itself, but transparent communication of results and concrete follow-up actions – otherwise, willingness to participate will decline over time.
What are the benchmarks for cost-per-hire in Germany?
Cost-per-hire varies considerably: for straightforward operational roles it is often between €500 and €2,000; for skilled professionals between €3,000 and €8,000; and for senior leaders it can be substantially higher. Industry studies such as the Kienbaum HR Trend Study or SHRM benchmarks provide reference values – though these should be interpreted with company size and region in mind.
Conclusion
HR statistics are not an end in themselves – they are the foundation of evidence-based people management. Those who collect the right metrics understand where improvement potential lies in the HR process: whether in recruiting (time-to-hire, cost-per-hire), in employee retention (turnover, tenure), or in engagement (eNPS). What matters is not the volume of data collected, but consistent focus on the KPIs that are strategically relevant for the organisation.
With a clear set of HR metrics, regular benchmark comparisons, and data-driven actions, HR transitions from administrative support function to strategic partner of leadership.
Want to find out how objective aptitude assessment can concretely improve your recruiting metrics? Learn more about the Aivy platform.
Sources
- DGFP Practical Paper on HR Metrics. Deutsche Gesellschaft für Personalführung e.V., 2023. https://www.dgfp.de
- Federal Employment Agency – Absenteeism and Sick Leave Statistics. Bundesagentur für Arbeit, 2024. https://statistik.arbeitsagentur.de
- SHRM: HR Metrics Toolkit. Society for Human Resource Management, 2023. https://www.shrm.org
- Gallup Engagement Index Germany. Gallup GmbH, 2024. https://www.gallup.com/de
- LinkedIn Talent Trends Report DACH. LinkedIn Ireland Unlimited Company, 2024. https://business.linkedin.com/talent-solutions/resources
- Kienbaum HR Trend Study. Kienbaum Consultants International GmbH, 2023. https://www.kienbaum.com

Make a better pre-selection — even before the first interview
In just a few minutes, Aivy shows you which candidates really fit the role. Beyond resumes based on strengths.