An HR KPI template is a structured tool (usually Excel or dashboard) that allows you to systematically capture, calculate, and visualize the most important HR metrics. Core HR KPIs include recruiting metrics (Time-to-Hire, Cost-per-Hire, Quality-of-Hire), retention metrics (turnover rate, employee retention), and performance indicators (productivity, goal achievement). With a well-designed template, you can make data-driven HR decisions and measure the effectiveness of your HR strategy.
What are HR KPIs?
HR KPIs (Key Performance Indicators) are measurable metrics that reflect the success of your HR strategy in the context of organizational goals. Unlike general metrics that simply capture data (e.g., number of applications), KPIs are strategically relevant metrics that directly contribute to defined business objectives.
A KPI must be SMART: Specific, Measurable, Achievable, Relevant, and Time-bound. For example, if your company wants to reduce recruiting costs, "Cost-per-Hire below $3,000" would be a concrete KPI. The simple metric "Recruiting costs: $45,000 per quarter" is descriptive but not goal-oriented.
KPIs vs. Metrics: The Difference
While metrics encompass a broad spectrum of information, KPIs as essential performance indicators relate directly to strategic goals. Not every measurable number is automatically a KPI – it must reflect the uniqueness and goals of your organization.
The Balanced Scorecard in HR
A proven framework for structuring HR KPIs is Kaplan and Norton's Balanced Scorecard. It divides KPIs into four perspectives:
- Financial Perspective: Cost-per-Hire, personnel costs as a percentage of revenue
- Customer Perspective: Candidate Experience, employee satisfaction (eNPS)
- Process Perspective: Time-to-Hire, completion rate in recruiting
- Learning and Development Perspective: Training effectiveness, internal promotion rate
According to a 2024 PwC study, companies with advanced HR analytics are 3x more successful at improving employee performance and 1.5x more successful at talent retention. HR KPIs are therefore not a "nice-to-have" but a strategic necessity.
The Most Important HR KPIs Overview
An HR KPI template should cover the following core areas. Choose 2-3 KPIs from each area that align with your organizational goals.
Recruiting KPIs
Time-to-Hire: The time from job posting to contract signing. It measures the efficiency of your recruiting process. The average in the US is 36 days according to SHRM, varying by industry and position.
Calculation: Time-to-Hire = Date of Job Acceptance - Date of Job Posting (in days)
Cost-per-Hire: The average costs per new hire. This includes recruiting software, job advertisements, personnel costs for interviews, and onboarding.
Calculation: Cost-per-Hire = Total Recruiting Costs ÷ Number of Hires
Quality-of-Hire: The quality of new employees, measured by performance, retention after 12 months, and cultural fit. High Quality-of-Hire is reflected in new employees exceeding their performance goals and staying with the company long-term.
Example: Of 20 new hires in 2024, 18 are still with the company after 12 months, and 15 exceed their performance expectations → Quality-of-Hire = 75%
Retention KPIs
Turnover Rate: The percentage of employees who leave the company within a period. A high turnover rate causes significant costs through recruiting and onboarding.
Calculation: Turnover Rate = (Number of Departures ÷ Average Number of Employees) × 100
Employee Retention Rate: The percentage of employees who were employed at the beginning of the year and are still with the company at year-end. It shows the stability of your workforce.
90-Day Quit Rate: The percentage of new employees who resign within the first 90 days. A high rate indicates problems in onboarding or poor hiring decisions.
Performance KPIs
Revenue per Employee: A metric for your company's overall productivity. It's calculated by dividing total revenue by the number of employees. Important: Benchmark within your industry, as values vary significantly.
Goal Achievement Rate: The percentage of employees who meet or exceed their individual or team goals. This KPI shows how effective your performance management system is.
Development KPIs
Training Effectiveness: Measures whether training programs have the desired effect. This can be captured through knowledge tests, performance improvement, or employee feedback.
Internal Promotion Rate: The percentage of leadership positions filled internally. A high rate shows that you're successfully developing and retaining talent.
HR KPI Template: Structure and Usage
A professional HR KPI template should contain three core elements: data collection, calculation, and visualization.
What Belongs in a KPI Template?
- Master Data Section: Capture all basic information (number of employees, new hires, terminations, recruiting costs). This data forms the foundation for all calculations.
- Formula Section: Predefined calculations for each KPI. Example: A cell for Time-to-Hire automatically calculates the difference between hiring date and posting date.
- Dashboard Section: Visual representation of KPIs in the form of charts. A well-designed dashboard shows at a glance whether you're achieving your goals or need to take action.
- Target Values & Benchmarks: Define a target value for each KPI (e.g., "Time-to-Hire < 35 days") and compare with industry benchmarks.
Excel vs. HR Software: Pros and Cons
Excel Template:
- ✓ Free and immediately available
- ✓ Flexibly customizable
- ✓ No training on new software needed
- ✗ Manual data entry time-consuming
- ✗ Error-prone with complex formulas
- ✗ No real-time data
HR Software (e.g., BambooHR, Workday, SAP SuccessFactors):
- ✓ Automated data collection
- ✓ Real-time dashboards
- ✓ Integration with other HR systems (ATS, time tracking)
- ✗ Subscription-based (~$50/month per user)
- ✗ Training time required
- ✗ Vendor dependency
Recommendation: Start with an Excel template if you have fewer than 50 employees or are just beginning with HR analytics. Switch to HR software once manual effort becomes too great or you need real-time reporting.
A hybrid solution is combining HR software with Power BI: You automatically pull data from your HR system (e.g., via API) and visualize it in a custom dashboard.
Dashboard Design: Visualizing Metrics
An effective KPI dashboard follows these principles:
- Less is More: Display a maximum of 8-10 KPIs per dashboard. Too many numbers overwhelm and dilute focus.
- Color Coding: Use a traffic light system (Green = goal achieved, Yellow = warning, Red = action needed). This allows you to immediately identify critical areas.
- Trend Visualization: Show not only current values but also development over time (e.g., Time-to-Hire for the last 12 months as a line chart).
- Comparison Values: Place actual values next to target values and benchmarks. This shows at a glance whether you're on track.
How to Select the Right KPIs
Selecting the right KPIs is crucial. Too many KPIs lead to overwhelm, too few leave important areas uncontrolled.
The SMART Criteria for KPIs
Every KPI should meet these five criteria:
Specific: The KPI describes exactly what is being measured. Instead of "improve recruiting" → "reduce Time-to-Hire from 50 to 35 days."
Measurable: You can capture the KPI quantitatively. "Employee satisfaction" is vague, "eNPS score above 30" is measurable.
Achievable: The KPI is ambitious but realistic. Reducing turnover rate from 25% to 5% within 3 months is unrealistic.
Relevant: The KPI directly contributes to organizational goals. If cost reduction is a priority, Cost-per-Hire and turnover costs are more relevant than training effectiveness.
Time-bound: The KPI has a clear timeframe. "By Q3 2026" instead of "sometime."
Checklist: 5 Steps to KPI Selection
Step 1: Define your HR strategy and organizational goals. Example: "We want to grow by 20% in 2026 and need 30 new employees for that."
Step 2: Identify critical HR areas. In a growth scenario, these are: recruiting efficiency, onboarding time, employee retention.
Step 3: Choose 2-3 KPIs per area. Focus on essentials: Time-to-Hire, Quality-of-Hire (recruiting), 90-Day-Quit-Rate (onboarding), Turnover Rate (retention).
Step 4: Define target values based on current values and benchmarks. If your current Time-to-Hire is 55 days and the industry average is 40 days, "45 days by Q2 2026" is a realistic goal.
Step 5: Review after 6 months. Adjust KPIs to changed priorities. If the growth goal is achieved, focus may shift to retention or productivity.
Avoiding Common Mistakes
Mistake 1: Tracking too many KPIs. Rule of thumb: Maximum 10 KPIs simultaneously. Less is more when it comes to focus.
Mistake 2: KPIs without target values. A KPI without a target value is just a metric. "Time-to-Hire: 48 days" says little. "Time-to-Hire: 48 days (Target: 40 days)" creates pressure for action.
Mistake 3: Only quantitative KPIs. Complement hard numbers with qualitative metrics. Alongside "number of hires," you should also measure "Candidate Experience Score."
Mistake 4: Viewing KPIs in isolation. Context matters. Low Time-to-Hire can be good – or indicate you're deciding too quickly and Quality-of-Hire is suffering.
Optimizing Recruiting KPIs with Digital Tools
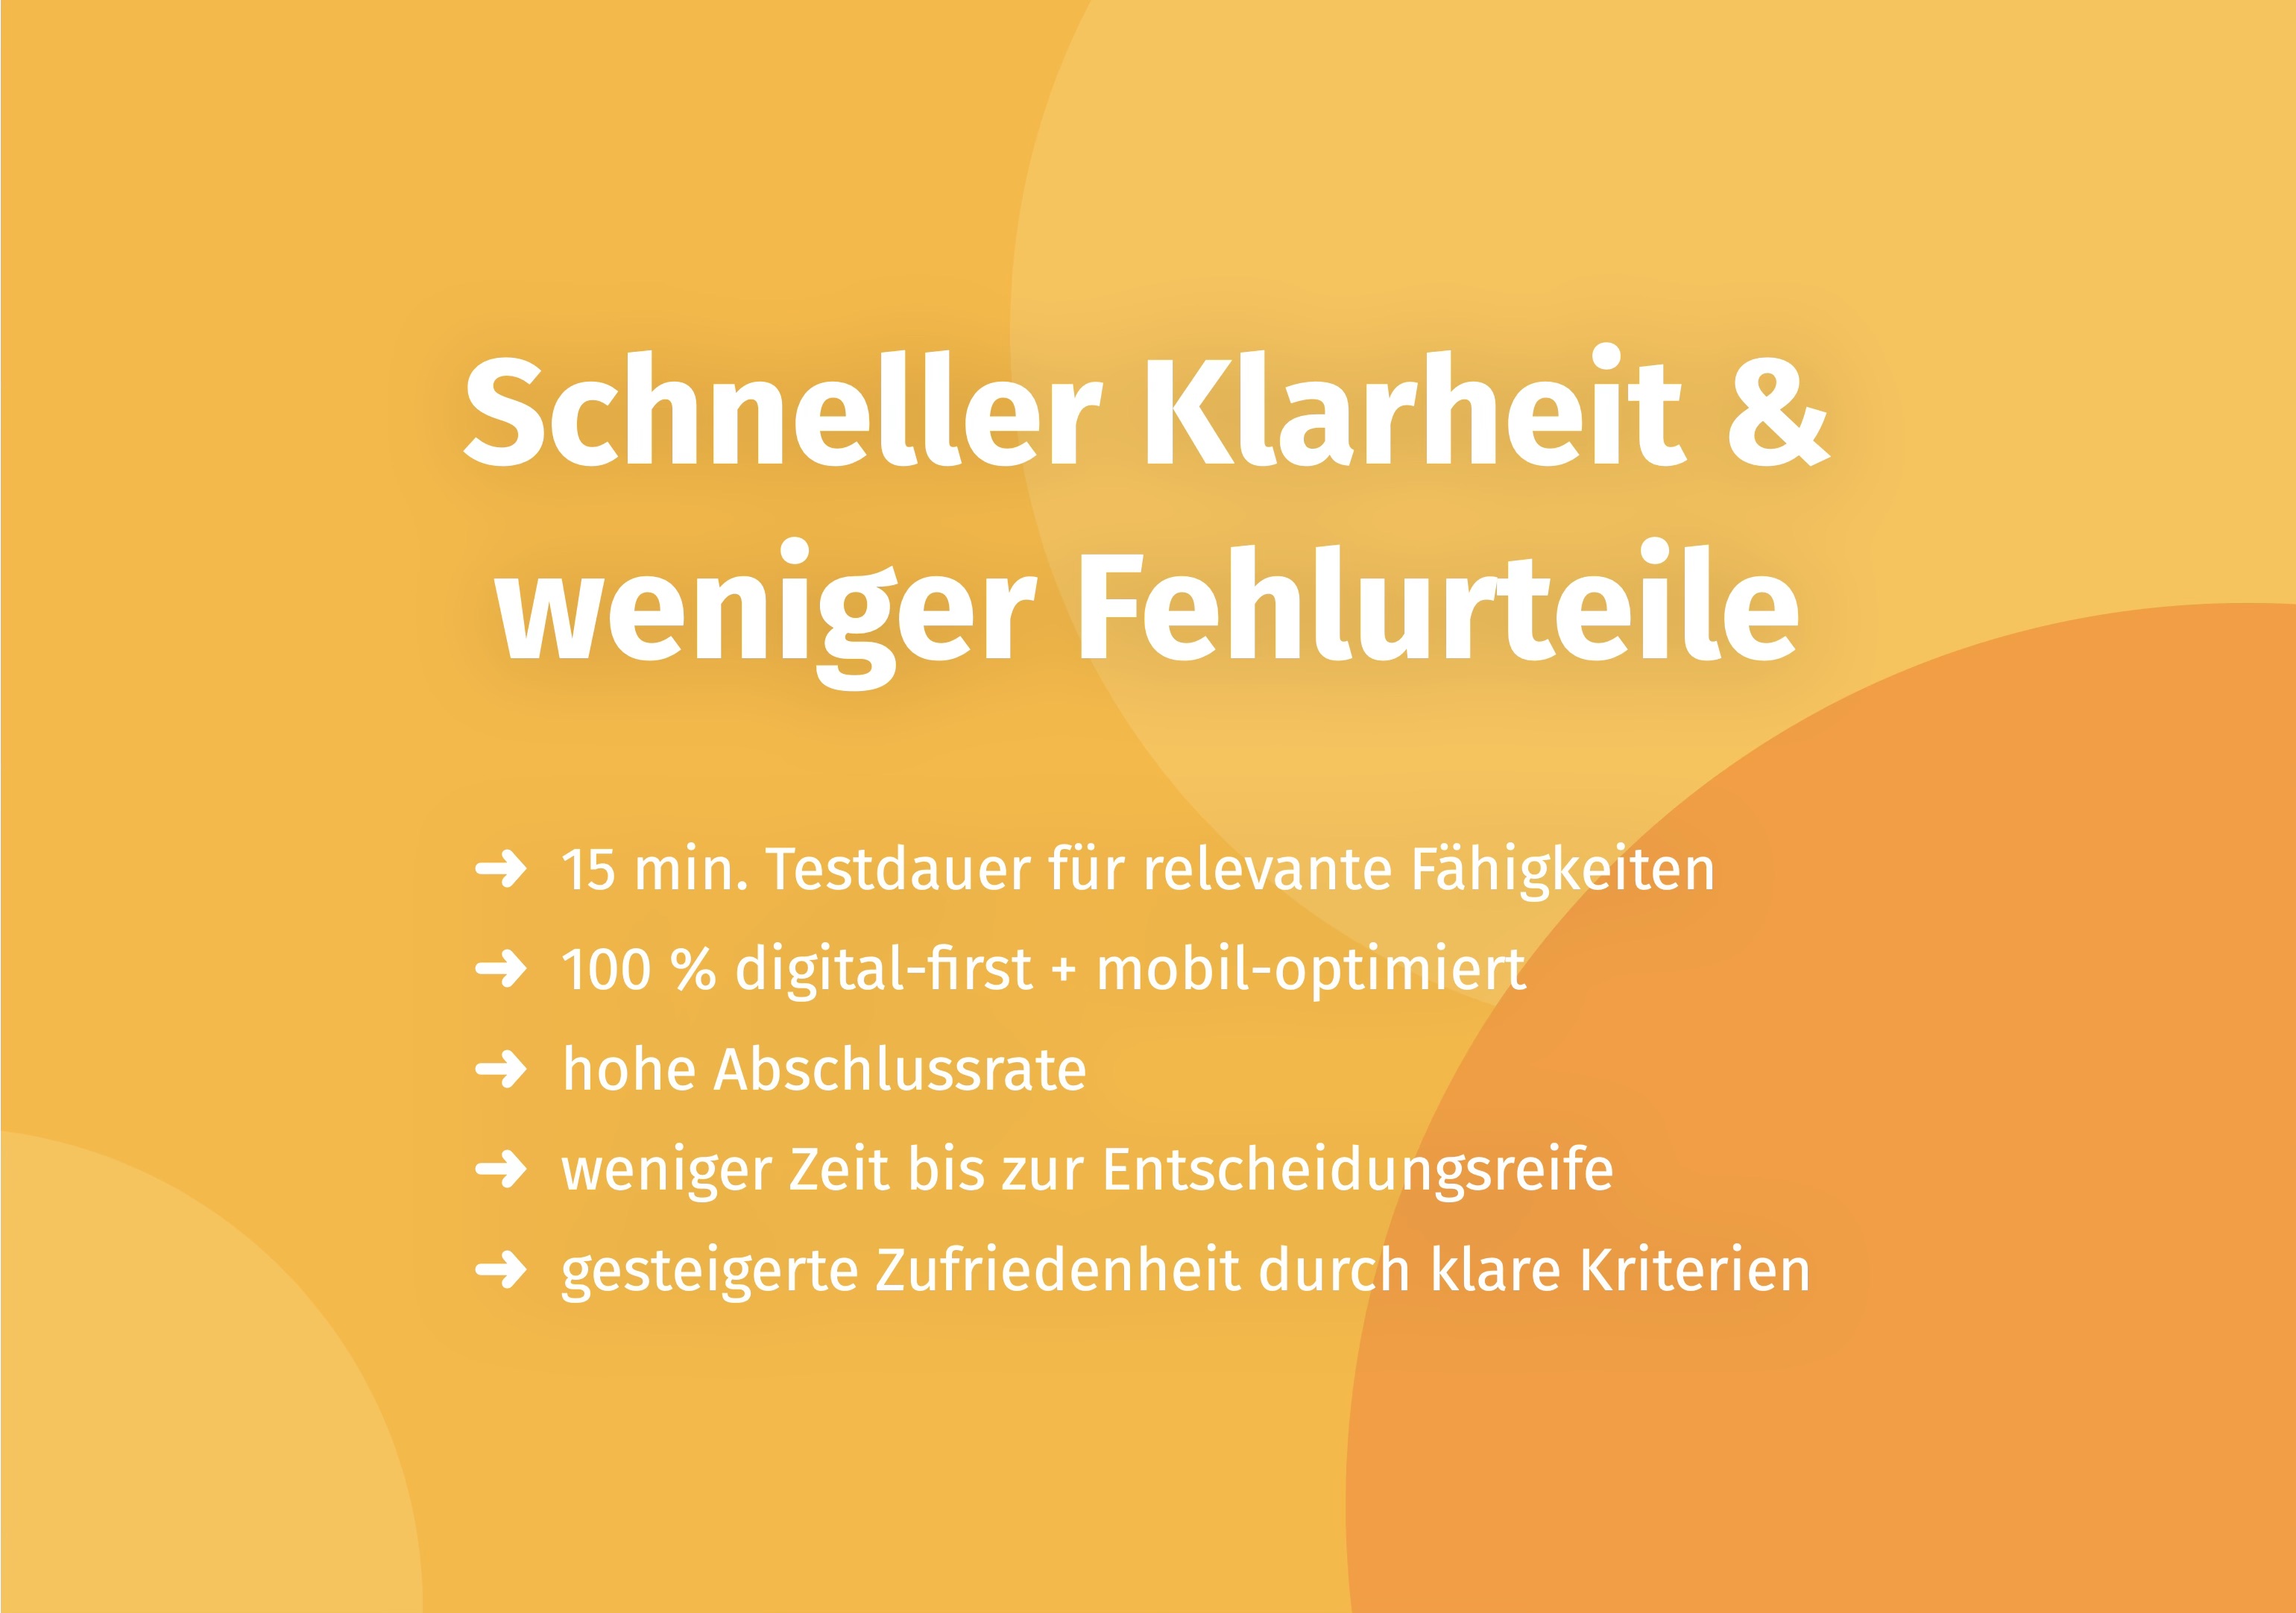
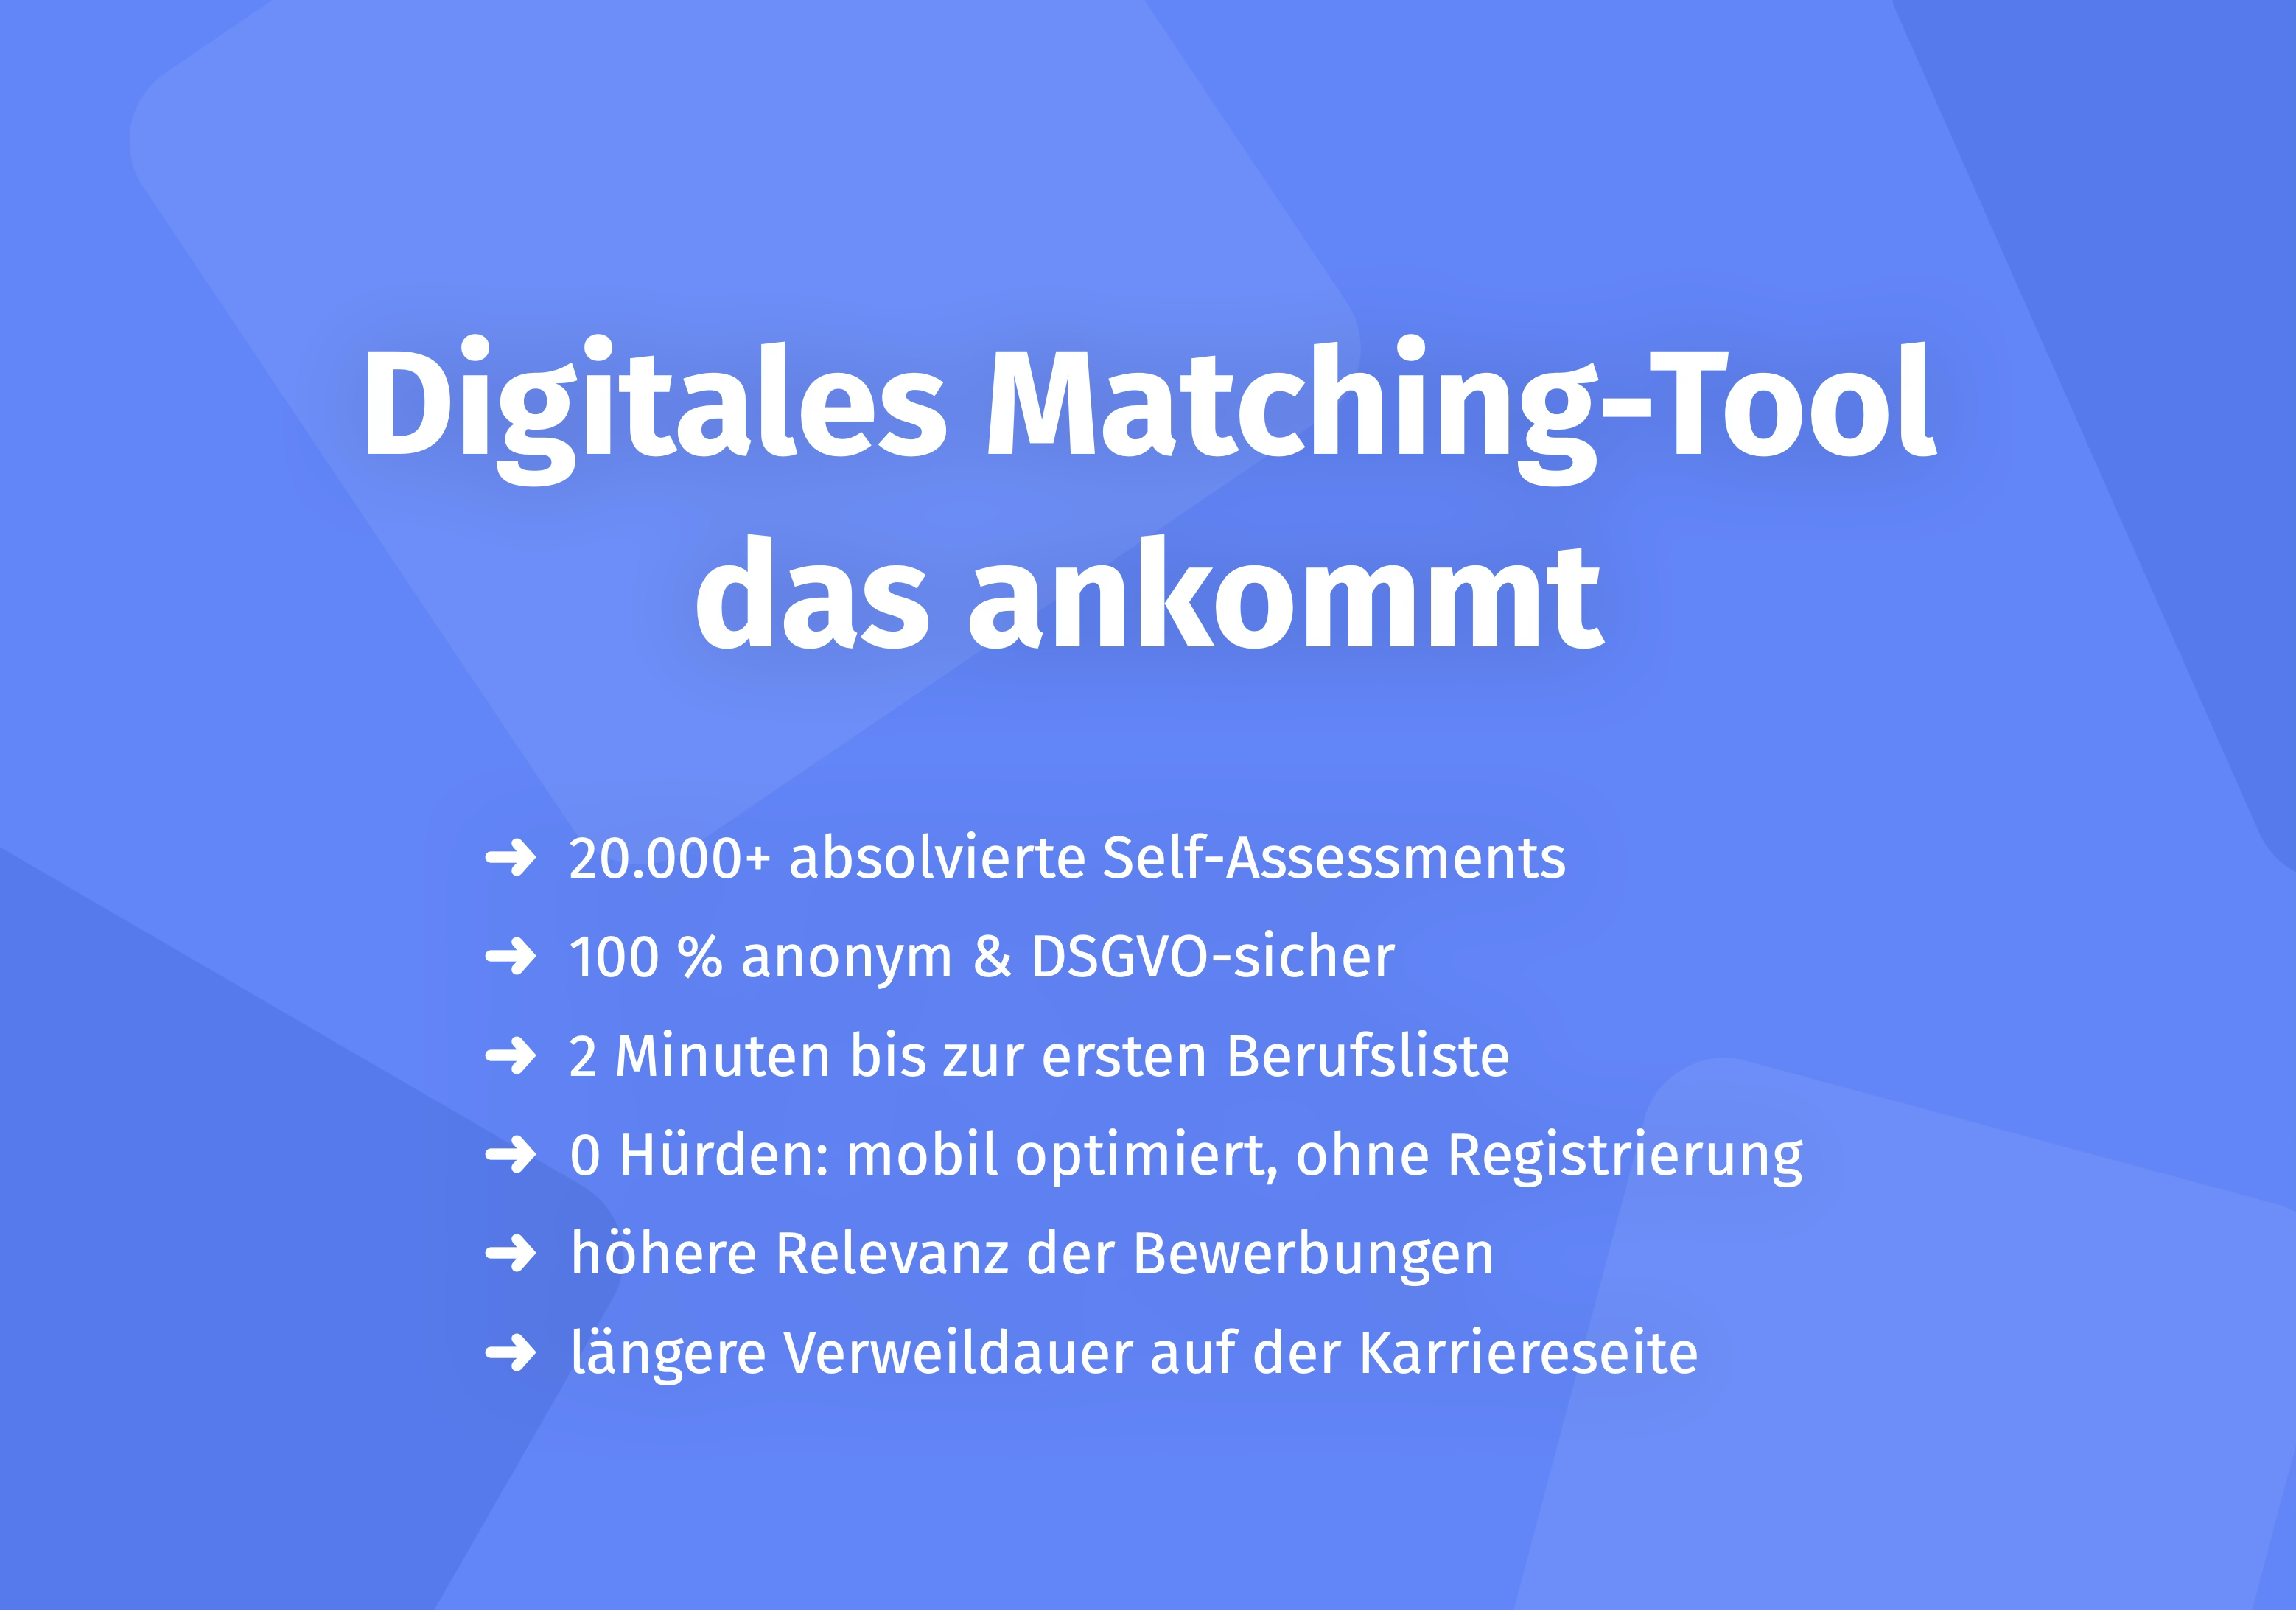
Digital talent assessment tools offer significant potential for optimizing KPIs, particularly in recruiting. Modern platforms enable objective, rapid evaluations through game-based assessments and scientifically validated methods.
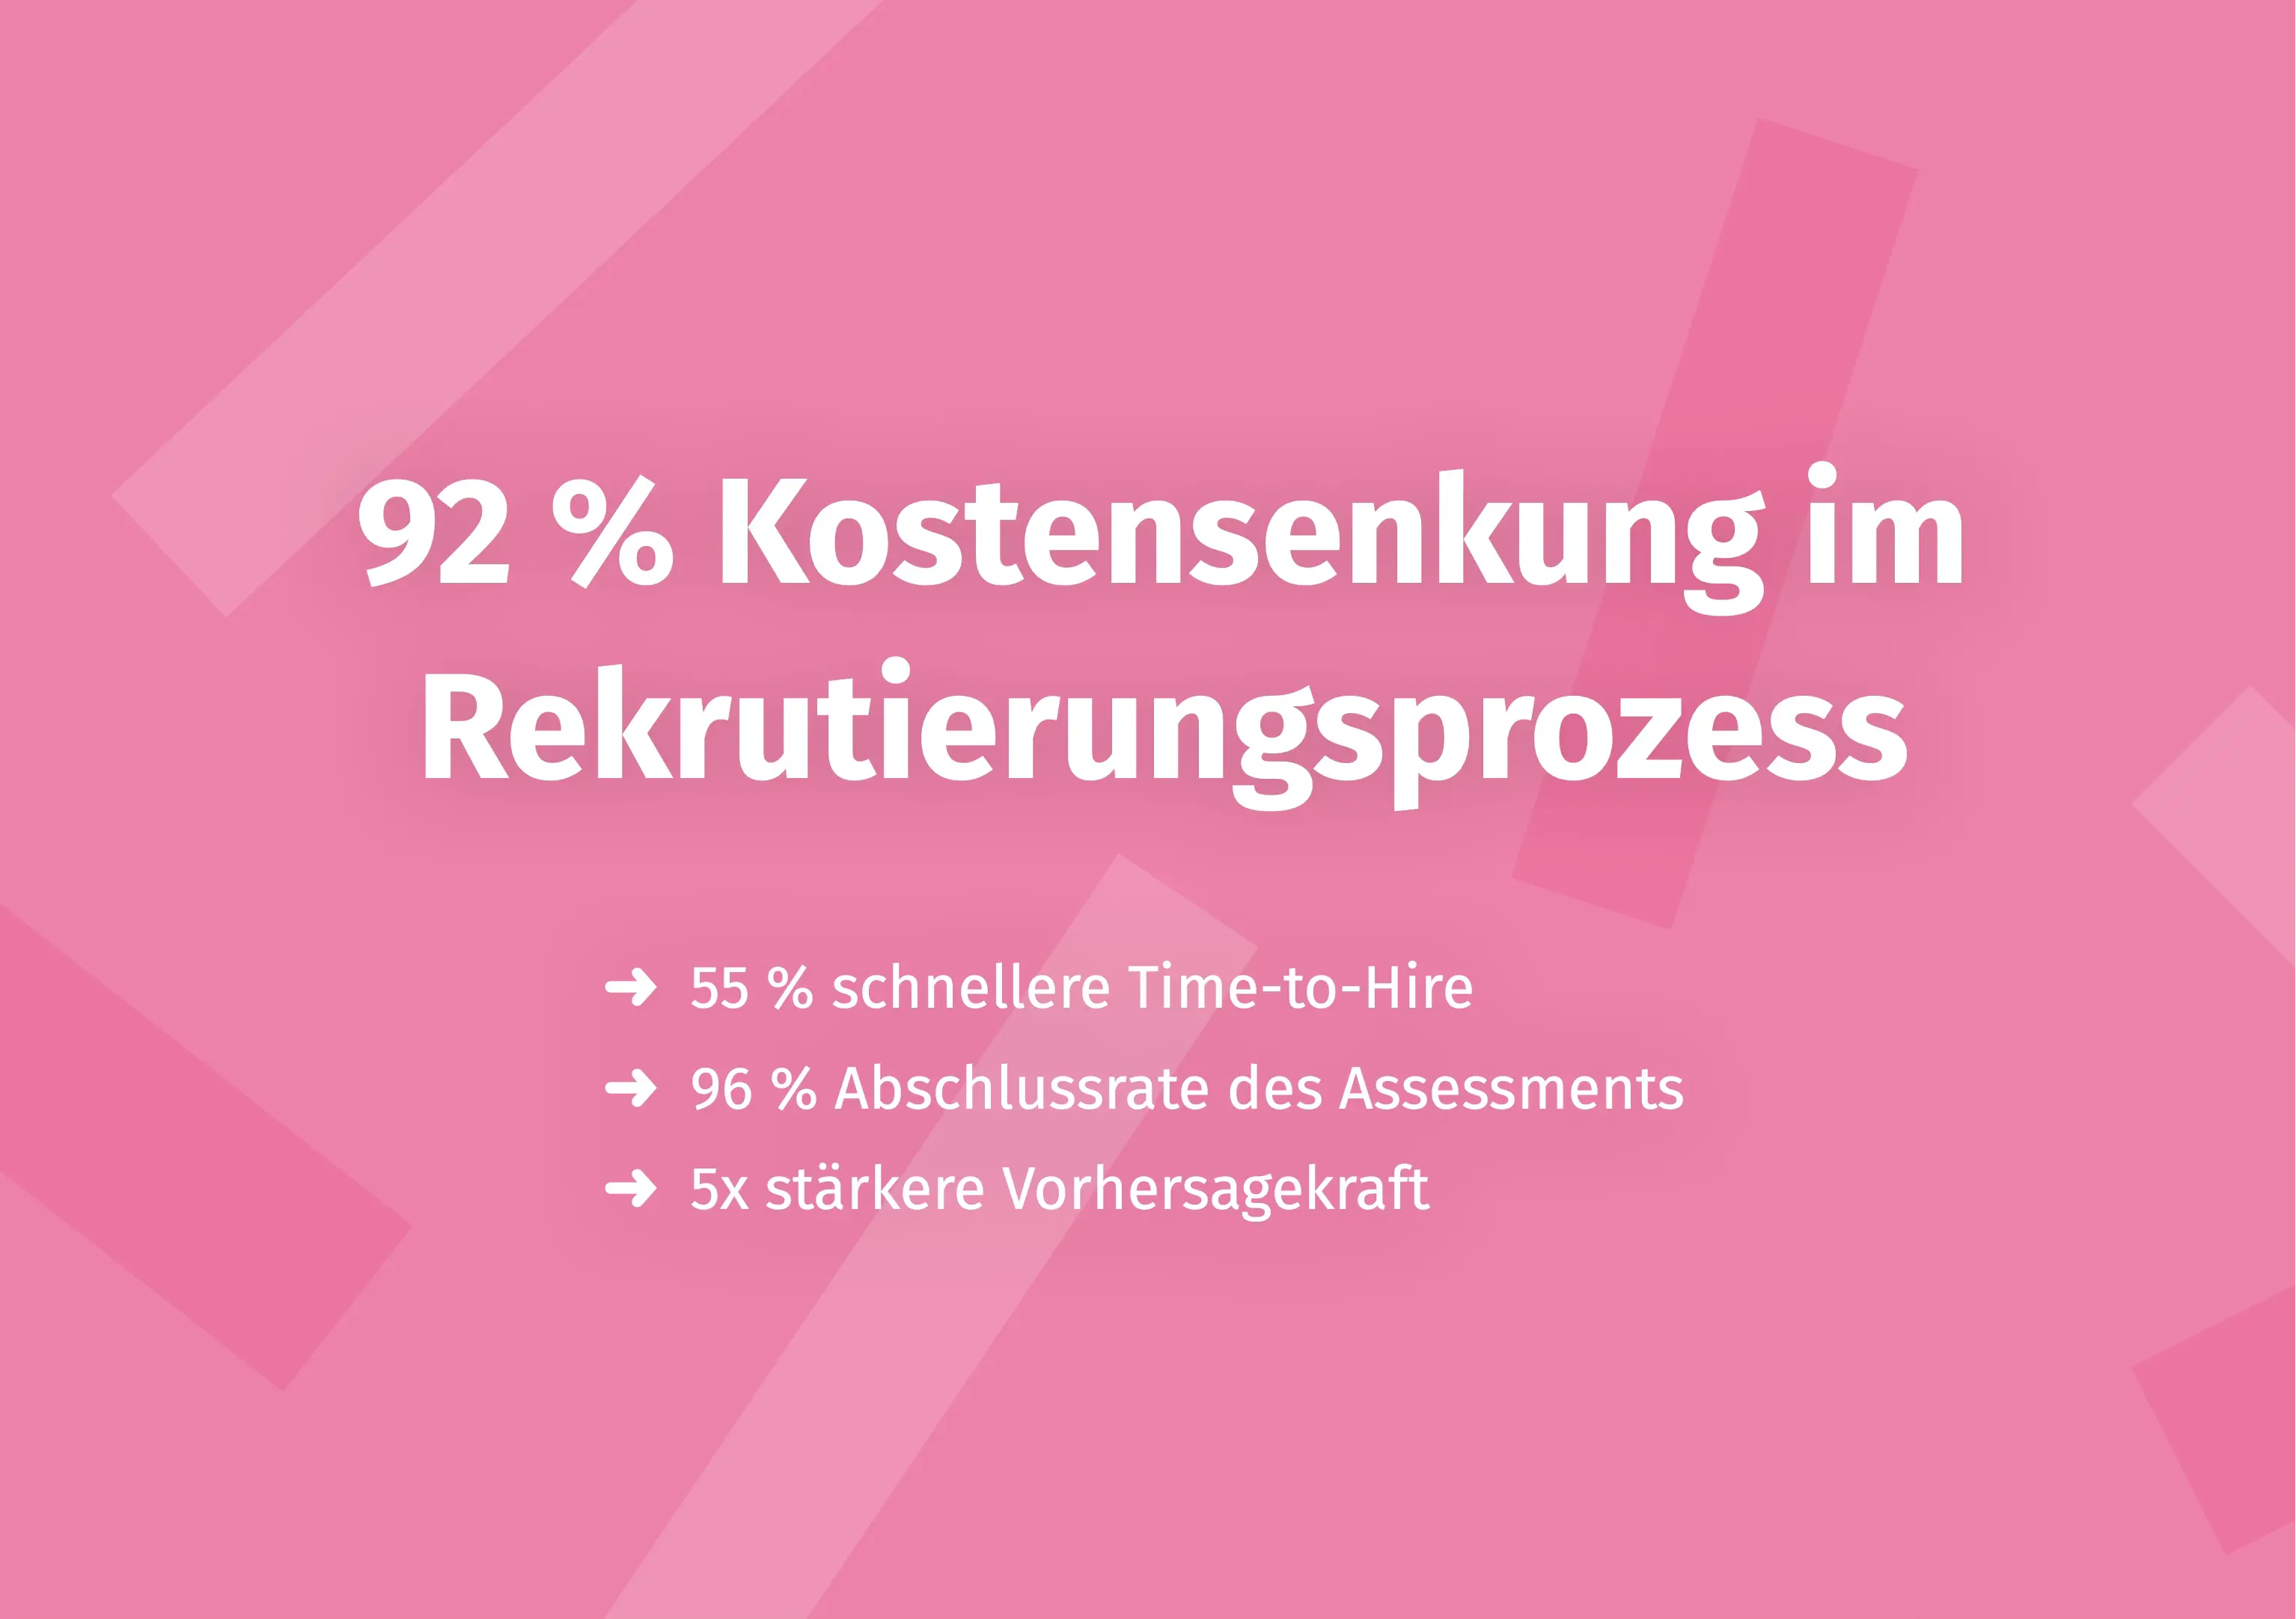
Real-world results demonstrate this: Companies like MCI Germany were able to reduce their Time-to-Hire by 55% and decrease Cost-per-Hire by 92% through digital talent assessment. The assessment completion rate was 96%, and predictive validity was 5x stronger than traditional methods.
Such tools work on three levels:
- Time-to-Hire Reduction: Quick assessments (15-20 minutes) enable efficient pre-selection. Instead of inviting 50 candidates to interviews, you focus on the 10 with the highest fit.
- Quality-of-Hire Improvement: Objective talent assessment increases accuracy. Scientifically validated methods reduce unconscious bias and measure relevant competencies instead of just resume fit.
- Cost-per-Hire Reduction: Efficient pre-selection means fewer interviews, fewer mis-hires, and thus lower overall costs.
Want to learn more about data-driven talent assessment? Learn more about objective recruiting processes with Aivy.
Frequently Asked Questions about HR KPI Templates
What is an HR KPI template?
An HR KPI template is a structured tool (usually Excel or dashboard) for capturing and visualizing HR metrics. It contains predefined formulas and categories (e.g., recruiting, retention, performance) and enables a quick start without needing to build KPI knowledge from scratch. The template helps make HR strategy measurable and track progress.
Which HR KPIs should I definitely track?
Focus on 5-10 strategically relevant KPIs: (1) Recruiting: Time-to-Hire, Cost-per-Hire, Quality-of-Hire (accuracy rate), (2) Retention: Turnover Rate, Employee Retention Rate, 90-Day Quit Rate, (3) Performance: Revenue per Employee, Goal Achievement Rate, (4) Development: Training Effectiveness, Internal Promotion Rate. Rule of thumb: Choose KPIs that directly contribute to your organizational goals.
How do I calculate Time-to-Hire?
The formula is: Time-to-Hire = Date of Job Acceptance - Date of Job Posting (in days). Example: Position posted on January 1st, candidate signs on February 15th → Time-to-Hire = 45 days. The US average is 36 days according to SHRM (varies by industry). The goal is reduction through efficient processes like objective talent assessment.
What's the difference between KPIs and metrics?
Metrics are all measurable data (e.g., number of applications, total salary). KPIs are strategically relevant metrics that directly contribute to organizational goals. Not every metric is automatically a KPI. KPIs must be SMART: Specific, Measurable, Achievable, Relevant, Time-bound.
Free HR KPI template – where can I find one?
Providers like AIHR, SHRM, and various HR software vendors offer free Excel templates for download. Look for predefined formulas, dashboard visualization, and customizability. Check whether the template suits your company size (SMB vs. enterprise). Alternatively, you can use HR software with integrated KPI dashboards (e.g., BambooHR, Workday).
Excel template or HR software for KPIs?
Excel template: Free, flexible, but manual effort (data entry, updates). HR software: Automated, real-time data, but subscription-based (from ~$50/month). Recommendation for SMBs: Start with Excel, switch to software when you have >50 employees. Hybrid solution: Power BI + HR system API for automated dashboards.
How many HR KPIs should I track?
Rule of thumb: 5-10 KPIs per HR area (recruiting, retention, performance). Less is more – too many KPIs lead to overwhelm and lack of prioritization. Focus on KPIs that directly contribute to strategic goals (e.g., cost reduction → Cost-per-Hire). Conduct annual reviews and adjust KPIs to changed goals (e.g., remote work rate since 2020).
How do I optimize recruiting KPIs with digital tools?
Modern talent assessment tools can significantly improve recruiting KPIs: (1) Time-to-Hire: Quick assessments (e.g., game-based diagnostics) shorten process duration, (2) Quality-of-Hire: Objective talent assessment increases accuracy and reduces mis-hires, (3) Cost-per-Hire: Efficient pre-selection reduces number of interviews and recruiting costs. Example: MCI Germany reduced Time-to-Hire by 55% and Cost-per-Hire by 92%.
Conclusion
HR KPI templates are essential tools for data-driven HR work. They enable you to make the effectiveness of your HR strategy measurable and continuously optimize it. The key to success lies in intelligent selection: Focus on 5-10 strategically relevant KPIs that meet SMART criteria and directly contribute to your organizational goals.
Start with a simple Excel template if you have fewer than 50 employees or are just beginning with HR analytics. Once your company grows or manual effort becomes too great, it's worth switching to HR software with automated reporting. Digital solutions like objective talent assessment offer particularly significant optimization potential in recruiting – for Time-to-Hire as well as Quality-of-Hire and Cost-per-Hire.
Remember: KPIs are a means to an end, not an end in themselves. They should help you make better decisions and continuously improve your HR work. Review and adjust your KPIs regularly to reflect changed priorities.
Learn more about data-driven talent assessment and optimizing recruiting KPIs at Aivy.
Sources
- AIHR Academy: HR KPIs: Guide, 20 Examples & Free Template. 2024. https://www.aihr.com/blog/human-resources-key-performance-indicators-hr-kpis/
- Kaplan, Robert S.; Norton, David P.: The Balanced Scorecard. Harvard Business Review Press, 1996.
- PwC: HR Analytics Study. 2024. https://www.pwc.com
- SHRM (Society for Human Resource Management): How to Establish Key Performance Indicators. 2023. https://www.shrm.org
- BambooHR: HR Metrics & Analytics Guide. 2024. https://www.bamboohr.com
- Workday: People Analytics Best Practices. 2024. https://www.workday.com
- Harvard Business Review: The New Science of Team Chemistry. 2024. https://hbr.org
- MCI Germany: Success Story – Digital Recruiting Transformation. Aivy, 2024. https://www.aivy.app/success-stories/mci-germany

Make a better pre-selection — even before the first interview
In just a few minutes, Aivy shows you which candidates really fit the role. Beyond resumes based on strengths.