HR Analytics (also known as People Analytics or Talent Analytics) is the systematic collection, analysis, and interpretation of employee-related data to make informed decisions in human resource management. Organizations use HR Analytics to measure metrics such as turnover rate, time-to-hire, or employee satisfaction and derive concrete actions from them. Studies show: Organizations that consistently use HR Analytics increase their productivity by up to 25% and reduce turnover by up to 50%.
What is HR Analytics?
HR Analytics refers to the systematic collection and analysis of employee-related data with the goal of improving workforce performance and optimizing strategic HR decisions. According to Gartner, HR Analytics is "the collection and application of talent data to improve critical talent and business outcomes."
At its core, it's about deriving actionable insights from raw HR data. Instead of relying on gut feelings or past experience, HR professionals make decisions based on measurable facts. Data analysis enables pattern recognition, trend prediction, and early problem identification.
HR Analytics has evolved from a nice-to-have to a strategic success factor in recent years. McKinsey studies demonstrate: Companies that intensively use People Analytics report 25% higher productivity and 50% lower turnover rates.
Difference between People Analytics and Workforce Analytics
The terms HR Analytics, People Analytics, and Workforce Analytics are often used interchangeably but differ in their focus:
HR Analytics concentrates on HR-specific processes and metrics such as recruiting, compensation, performance management, and labor costs. The focus is on optimizing HR functions.
People Analytics examines the entire employee experience across various data sources – not just HR systems, but also IT data, feedback platforms, and external benchmarks. This approach is more holistic and considers the complete employee journey.
Workforce Analytics also includes external workers such as freelancers, temporary workers, or consultants. This perspective is particularly relevant for organizations with hybrid work models.
In practice, the terms are often used interchangeably. What matters less is the terminology than the strategic use of data-driven insights to improve HR processes and business outcomes.
Why is HR Analytics Important?
HR Analytics transforms the HR department from an administrative function to a strategic business partner. Data-driven decisions replace assumptions and gut feelings with measurable facts.
Strategic Value: HR Analytics enables linking people-related decisions directly to business objectives. Instead of reacting, HR teams can act proactively – for example, by identifying resignation risks early or determining which recruiting channels deliver the best talent.
Measurable Success: The numbers speak for themselves. McKinsey analyses show that organizations with strong People Analytics capabilities achieve 25% higher productivity. At the same time, turnover decreases by up to 50%, which means significant cost savings. A Deloitte study also found that data-driven HR departments are three times more likely to be perceived as strategically valuable.
Competitive Advantage: In times of talent shortage, the quality of HR decisions determines business success. Those who attract, develop, and retain the best talent gain a sustainable advantage over competitors.
Cost Savings: Targeted analyses help identify inefficient processes. Examples: Excessively high cost-per-hire due to wrong recruiting channels, unnecessary overtime due to poor workforce planning, or high turnover due to avoidable resignation reasons.
HR Analytics is not an end in itself but a strategic tool that helps HR departments make a measurable contribution to business success.
The 4 Types of HR Analytics
HR Analytics can be divided into four development stages that differ in their complexity and strategic value:
Descriptive Analytics – What Happened?
Descriptive Analytics describes past events through the analysis of historical data. This basic form of analysis answers the question: "What happened?"
Typical applications are reports on turnover rates, absence times, recruiting success, or salary structures. The data is usually visualized in dashboards and enables a quick overview of the current state.
Example: "The turnover rate in the last quarter was 12%, compared to 8% in the same quarter last year."
Descriptive Analytics is the entry point for data-driven HR and forms the foundation for all advanced forms of analysis.
Diagnostic Analytics – Why Did It Happen?
Diagnostic Analytics goes one step further and analyzes the causes behind observed trends. The central question is: "Why did it happen?"
Through statistical methods such as correlation analyses or segmentations, relationships are identified. HR teams can thus understand which factors influence certain developments.
Example: "The high turnover in the IT department correlates with below-average salaries and lacking development opportunities."
These insights form the basis for targeted interventions and process improvements.
Predictive Analytics – What Will Happen?
Predictive Analytics uses historical data and statistical models to forecast future developments. The question is: "What will probably happen?"
Using machine learning and algorithms, HR teams can identify risks early – for example, which employees are likely to resign or which candidates will be successful in recruiting.
Example: "Employee X has a 75% resignation probability within the next 6 months, based on engagement scores and performance data."
This forward-looking analysis enables proactive action before problems escalate.
Prescriptive Analytics – What Should I Do?
Prescriptive Analytics is the most advanced form and combines all previous levels to derive concrete action recommendations. The question is: "What should I do?"
Based on simulations and optimization models, various scenarios are tested and the best course of action is determined.
Example: "To reduce turnover in the IT department by 30%, you should increase salaries by 8% and introduce a mentoring program. Expected ROI: 4:1."
Prescriptive Analytics thus delivers not just data, but directly actionable solutions.
The Most Important HR Metrics & KPIs
HR metrics are measurable data points from the HR domain. HR KPIs (Key Performance Indicators) are strategically important metrics that directly contribute to business objectives. While every metric is a measure, not every measure is a strategic KPI.
The selection of the right KPIs depends on specific business objectives. Here are the most important categories:
Recruiting KPIs
Time-to-Hire: The average number of days from first contact with candidates to contract signing. A short time-to-hire reduces productivity losses and improves candidate experience.
Cost-per-Hire: The total costs incurred for filling a position – including job postings, recruiting software, personnel costs, and onboarding. Optimizing this metric leads directly to cost savings.
Quality-of-Hire: Measures how well new employees perform. Indicators are performance reviews after 6-12 months, retention rate, or evaluations by supervisors. This metric is crucial for evaluating the effectiveness of the recruiting process.
Retention KPIs
Turnover Rate: The percentage of employees who leave the organization within a specific period. Calculation: (Number of resignations / Average number of employees) × 100. High turnover causes enormous costs through recruiting, onboarding, and productivity losses.
Retention Rate: The opposite of turnover – how many employees remain loyal to the organization? A high retention rate is an indicator of satisfaction and company culture.
Employee Net Promoter Score (eNPS): Measures employee loyalty through the question: "How likely would you recommend the company as an employer?" (scale 0-10). The eNPS is a strong predictor of turnover and engagement.
Performance KPIs
Productivity: Measures performance per employee, such as revenue per capita or output metrics. This metric helps quantify the value contribution of the workforce.
Performance Rating: Average performance scores from annual or quarterly reviews. Combined with other data, high performers can be identified and specifically promoted.
Goal Achievement Rate: Percentage of achieved annual goals (OKRs, KPIs). This metric shows how well individual performance is synchronized with strategic business objectives.
Important: The selection of the right KPIs should always be aligned with specific business objectives. Less is more – 5-7 well-maintained KPIs are better than 30 superficially measured metrics.
Data Sources for HR Analytics
The quality of HR Analytics depends on the quality of the underlying data. Organizations typically use multiple data sources to obtain a holistic picture:
HRIS (HR Information System): The HRIS is the central data source for master data, contracts, salaries, absences, and organizational structures. Modern systems like Personio, Factorial, or BambooHR already offer integrated analytics functions.
ATS (Applicant Tracking System): Recruiting data such as applicant numbers, conversion rates, source channels, and time-to-hire are captured here. This data is essential for optimizing the recruiting process.
Time Tracking Systems: Working hours, overtime, and absences provide insights into workload, productivity, and potential burnout risks.
Employee Surveys: Engagement surveys, pulse surveys, and 360-degree feedback capture qualitative data on satisfaction, motivation, and company culture.
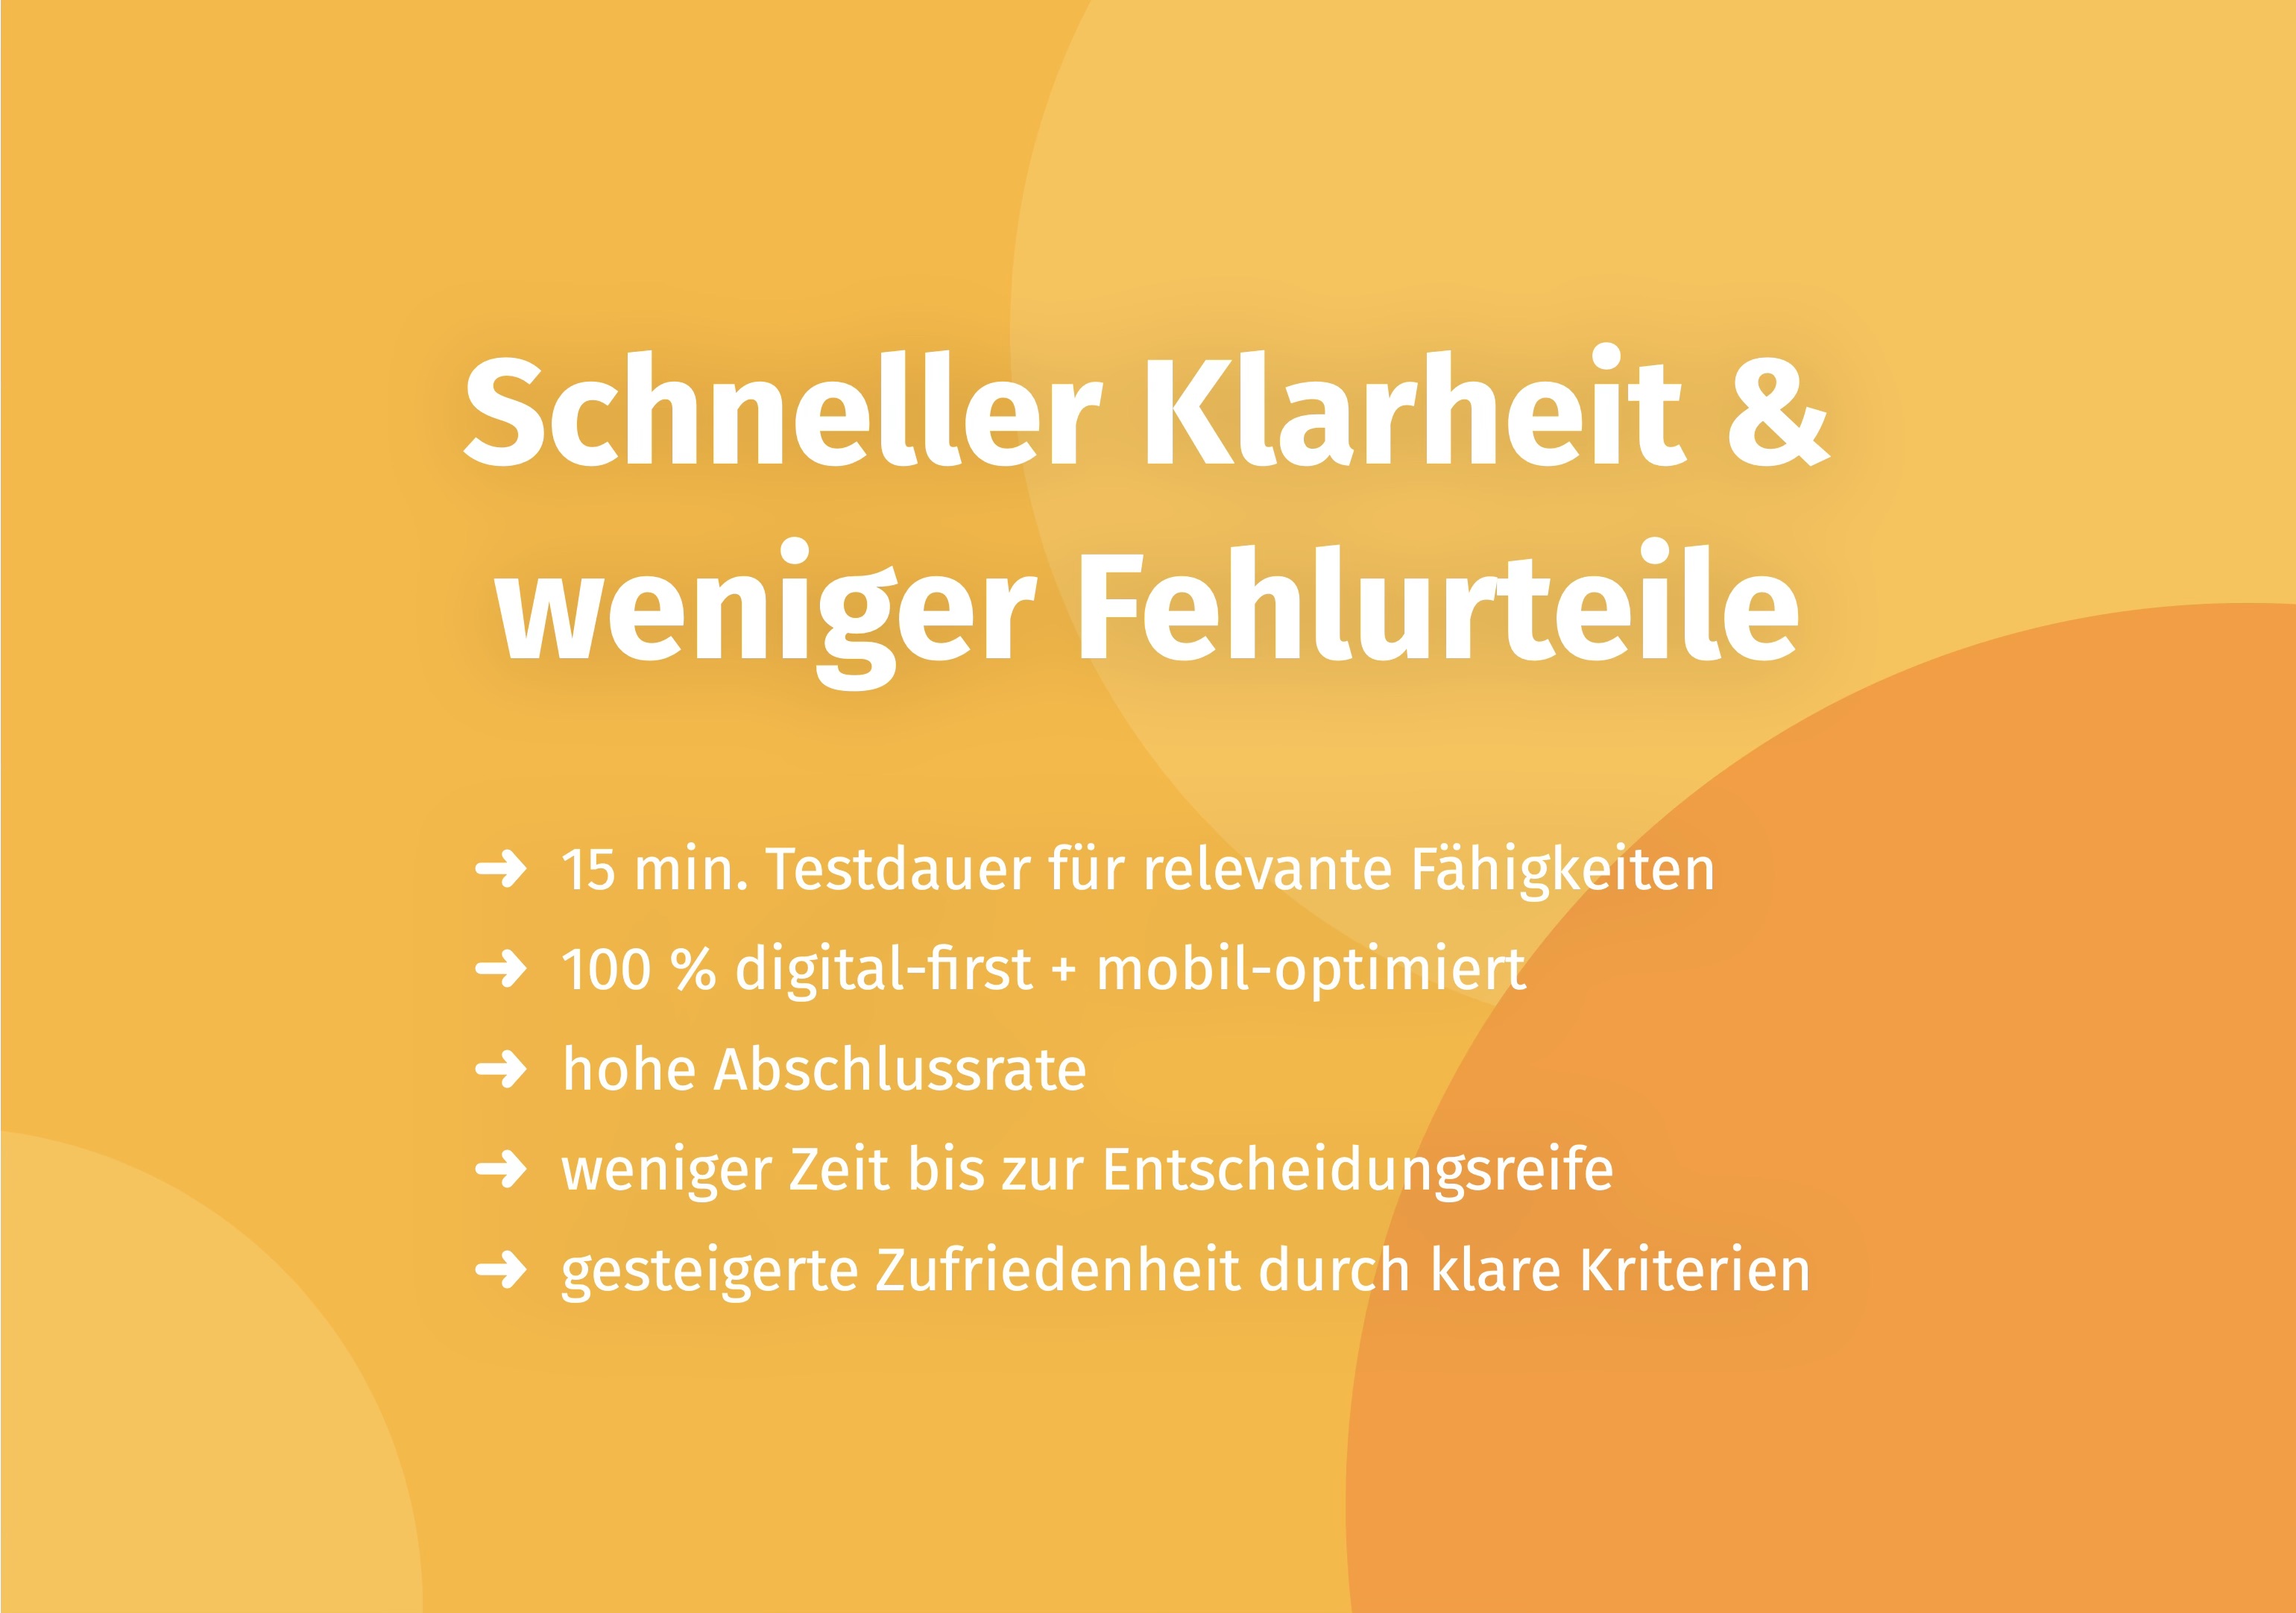
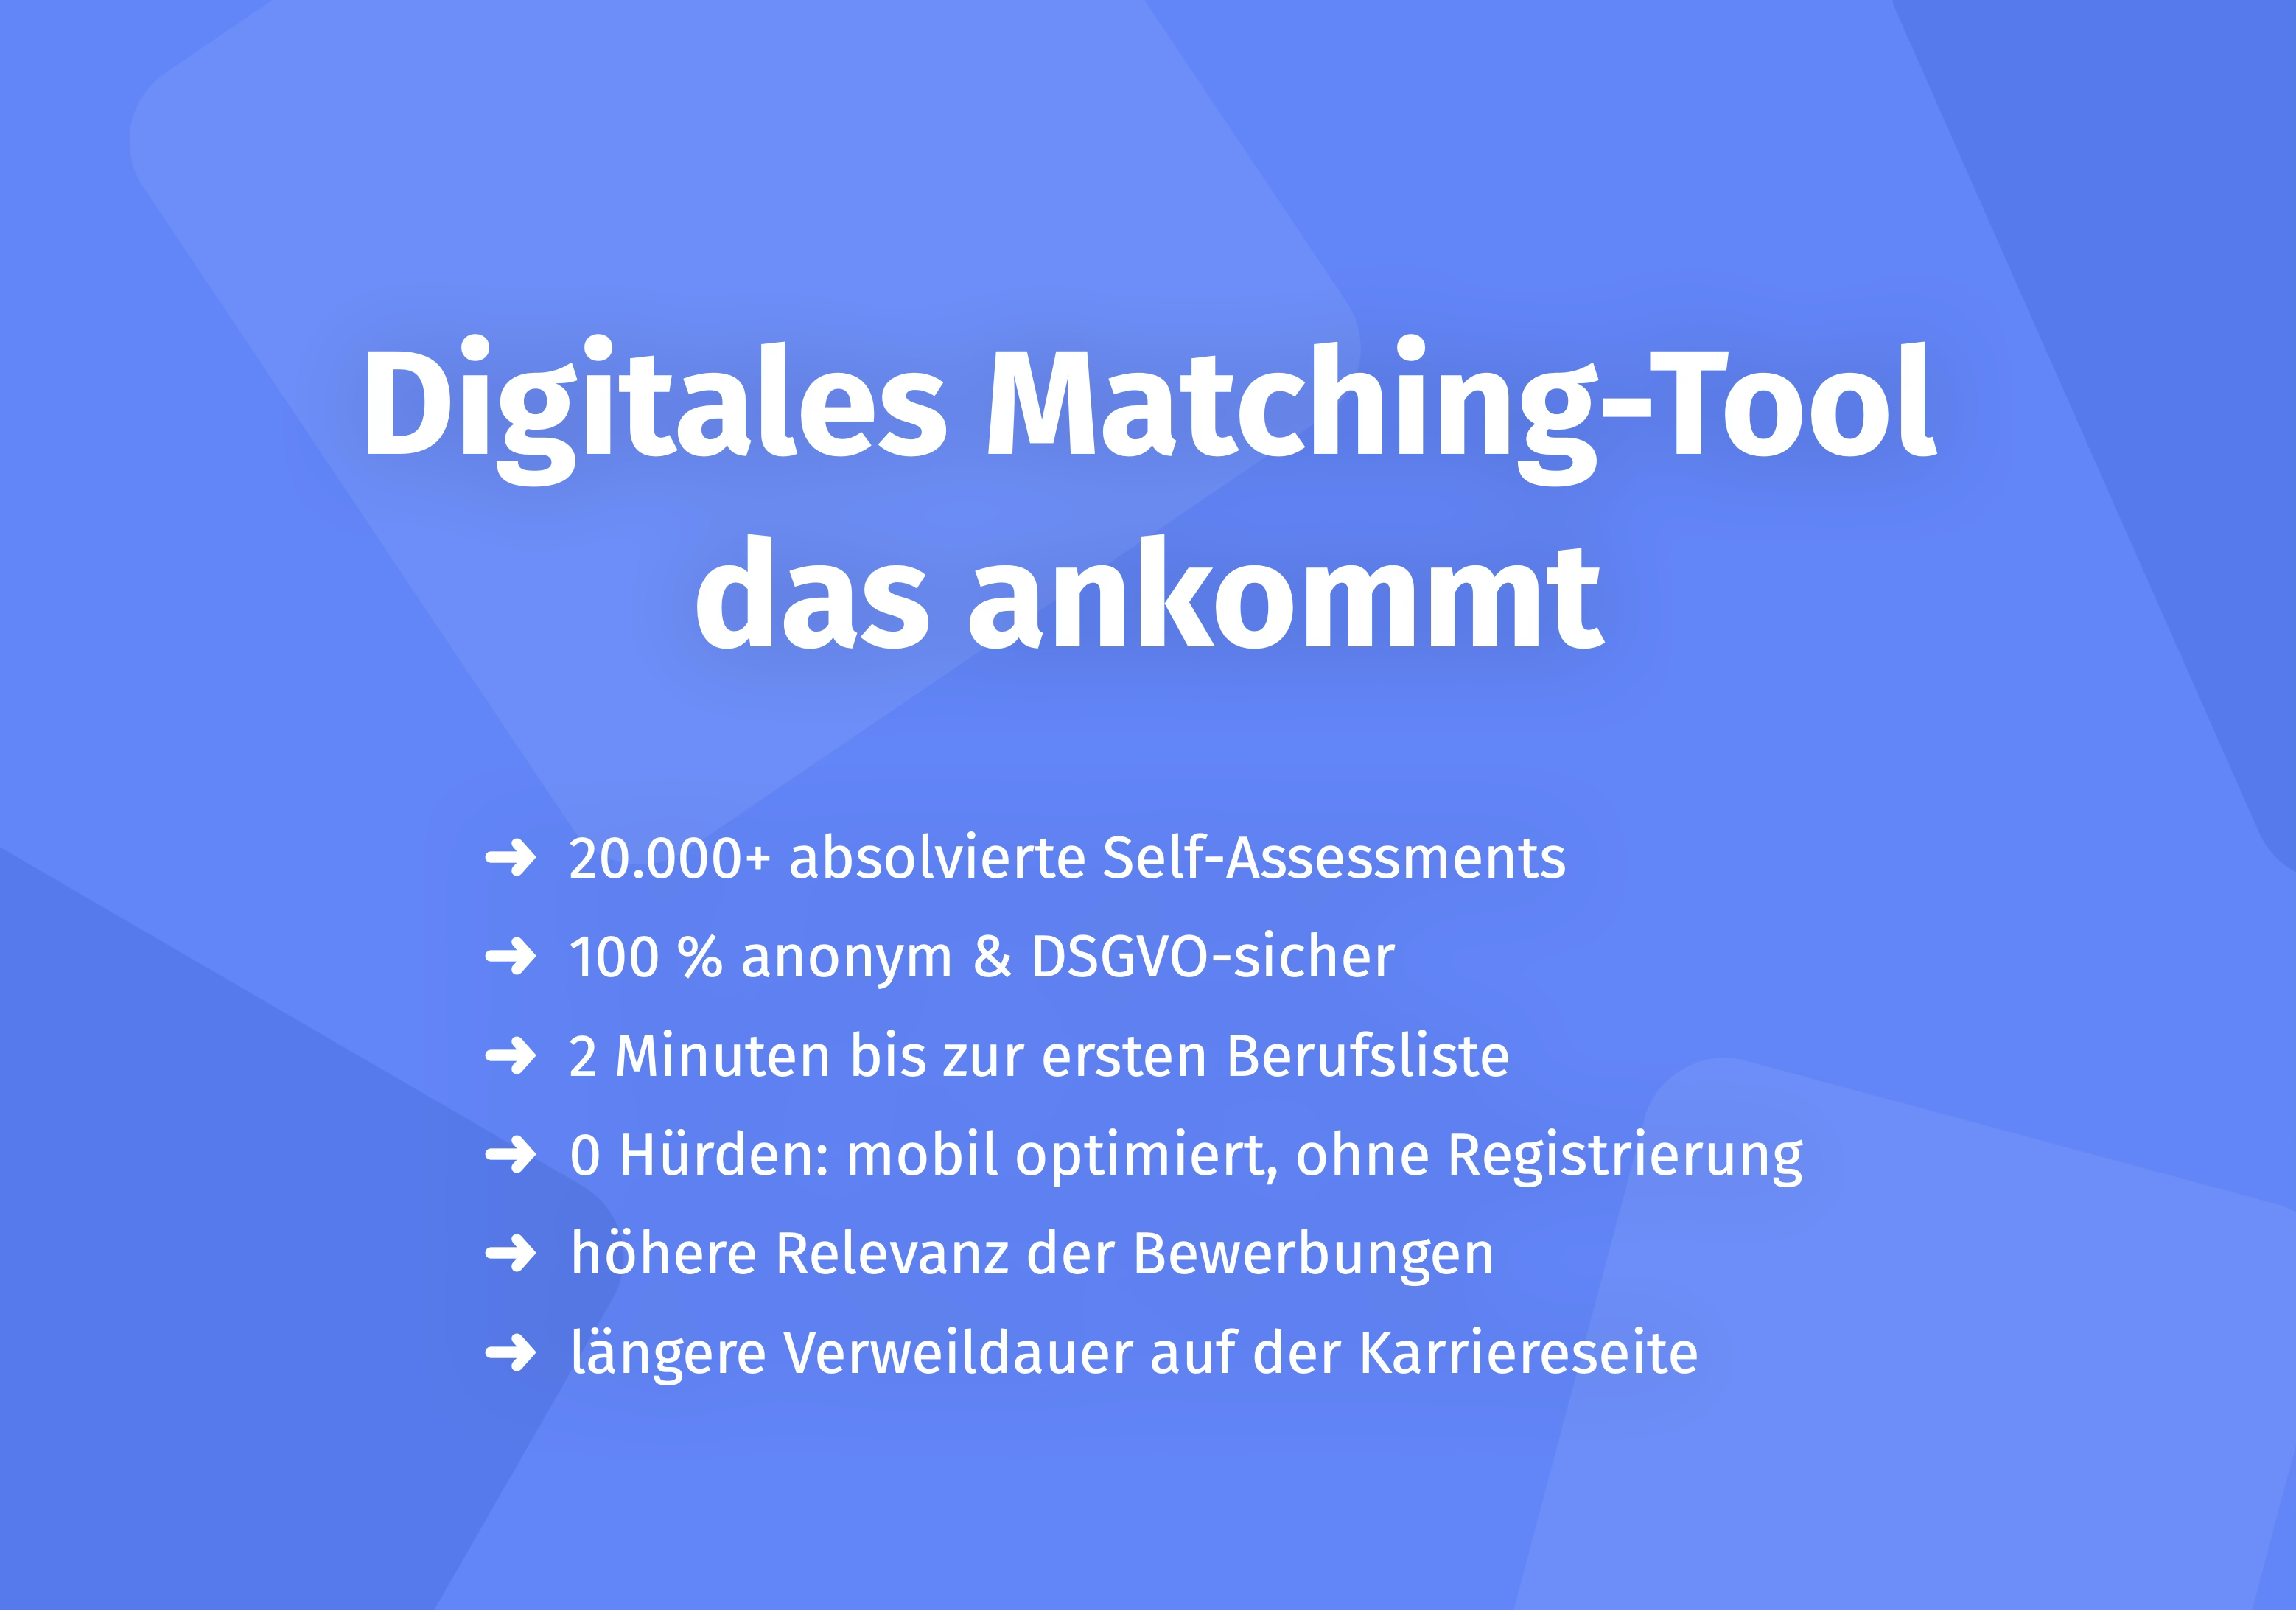
Objective Talent Assessment: Assessment results from scientifically validated tests deliver objective data on competencies, potentials, and cultural fit. Platforms like Aivy enable integrating game-based assessments into the recruiting process, thereby increasing data quality for HR Analytics. In contrast to pure CV data, these insights are based on standardized, scientifically validated procedures and reduce unconscious bias.
Performance Reviews: Performance reviews, goal agreements, and development plans document individual performance and employee development.
The integration of various data sources is crucial: Only through linking HRIS data with engagement scores and performance metrics do actionable insights emerge. Modern HR Analytics platforms automate this integration and significantly reduce manual effort.
How to Get Started with HR Analytics – Quick Guide
Getting started with HR Analytics doesn't have to be complicated. This 5-step plan lays the foundation for data-driven HR:
Step 1: Define Goals
Start with clear, measurable goals. Which problem do you want to solve? Examples:
- "Reduce turnover in the IT department by 15%"
- "Shorten time-to-hire for senior positions by 20 days"
- "Increase employee satisfaction from 3.8 to 4.2 (out of 5)"
Avoid vague formulations like "better HR." Use the SMART method instead (Specific, Measurable, Achievable, Relevant, Time-bound).
Step 2: Identify Relevant Metrics
Which KPIs measure the success of your goals? If you want to reduce turnover, you need:
- Current turnover rate (total + by department)
- Resignation reasons from exit interviews
- Engagement scores
- Salary satisfaction
Focus on 3-5 core metrics that directly contribute to your goal.
Step 3: Collect Data
Check which data is already available:
- HRIS: Master data, resignations, salaries
- ATS: Recruiting metrics
- Surveys: Engagement, feedback
Systematically capture missing data – for example through structured exit interviews or regular pulse surveys. Important: Quality over quantity. Better to capture few metrics cleanly than many incompletely.
Step 4: Analyze Data
Start with Descriptive Analytics: What do the data show? Use simple visualizations (Excel, Google Sheets) to begin. Questions you should answer:
- Are there patterns? (e.g., higher turnover in certain departments)
- Are there outliers? (e.g., individual months with extremely high turnover)
- Are there correlations? (e.g., between salary and resignation rate)
Formulate hypotheses: "Employees in team X resign more frequently because the manager is problematic."
Step 5: Derive and Measure Actions
Based on your insights, define concrete actions:
- Hypothesis: "Poor leadership leads to high turnover"
- Action: "Leadership coaching for team X"
- Measurement: "Measure turnover in team X again after 6 months"
Test, learn, optimize. HR Analytics is an iterative process – not every action will work immediately. What matters is that you learn from data and continuously improve.
Data Privacy: GDPR Compliance in HR Analytics
HR Analytics operates in a legally sensitive area. Employee data is personal data and subject to the General Data Protection Regulation (GDPR) in the EU, and similar regulations in other jurisdictions.
Legal Basis: You need a legal basis for processing employee data – either employee consent or a legal foundation (e.g., employment contract). For analytics projects that go beyond normal HR work, explicit consent is usually required.
Anonymization and Pseudonymization: Personal data should be anonymized as much as possible. Instead of "Employee Smith," you use "Employee ID 4782." For department-level analyses, complete anonymization is often possible.
Works Council Involvement (EU): The implementation of HR Analytics is subject to co-determination. The works council must be informed and involved – especially when it comes to performance measurements or automated decisions.
Transparency: Communicate openly which data is collected for what purpose. Employees have the right to know how their data is used.
Data protection is not an obstacle to HR Analytics but a framework that ensures analyses are conducted ethically and legally.
HR Analytics Tools & Software
The selection of the right tools depends on company size, budget, and technical maturity:
For Getting Started (small companies, <50 employees):
- Excel / Google Sheets: Free, flexible, and sufficient for basic analytics. Suitable for Descriptive Analytics and simple dashboards.
- HRIS with Analytics Functions: Personio, Factorial, or BambooHR offer integrated reporting functions that enable a good start.
For Mid-sized Companies (50-500 employees):
- Personio: All-in-one HR software with strong analytics features, especially optimized for German-speaking markets.
- Factorial: Cost-effective alternative with good reporting and People Analytics functions.
- BambooHR: Focus on employee experience with integrated engagement analyses.
For Large Enterprises (>500 employees):
- Visier: Specialized People Analytics platform with advanced predictive functions.
- Workday Analytics: Enterprise solution with comprehensive analysis capabilities and AI-powered insights.
- SAP SuccessFactors: Integrated analytics suite for large, international organizations.
Business Intelligence Tools (for all sizes):
- Tableau, Microsoft Power BI: Professional dashboards for advanced analyses. Enable combining HR data with other business data.
The best software is the one you actually use. Start simple, gain experience, and then scale. A simple Excel dashboard is better than expensive software that no one can operate.
Frequently Asked Questions about HR Analytics
What is the difference between HR Analytics and People Analytics?
HR Analytics focuses on HR-specific data such as recruiting, compensation, and performance. People Analytics examines the entire employee experience across multiple data sources (HR, IT, feedback). Workforce Analytics also includes external workers (freelancers, temporary workers). In practice, the terms are often used interchangeably.
Which HR metrics are most important?
The most important KPIs depend on your business objectives. Typical categories are: Recruiting (Time-to-Hire, Cost-per-Hire, Quality-of-Hire), Retention (Turnover Rate, Employee Retention, eNPS), Performance (Productivity, Performance Rating, Goal Achievement), and Engagement (Employee Satisfaction, Absenteeism Rate, Overtime). Focus on 5-7 metrics that directly contribute to strategic goals.
Do I need expensive software for HR Analytics?
No – you can start with Excel or Google Sheets. More important than the software is: defining clear goals and collecting relevant data. HRIS systems like Personio, Factorial, or BambooHR offer integrated analytics functions for mid-sized companies. For large organizations, specialized tools like Visier or Workday Analytics can make sense.
How do I get started with HR Analytics?
Follow this 5-step plan: 1. Define clear goals (e.g., "Reduce turnover by 10%"). 2. Identify relevant metrics (e.g., turnover rate, exit interview data). 3. Collect data from existing systems (HRIS, ATS, time tracking). 4. Analyze data and derive hypotheses (e.g., "High turnover in department X"). 5. Test actions and measure success.
Is HR Analytics GDPR-compliant?
Yes – but only if you comply with data protection regulations. Employee data is personal data and subject to strict protection requirements. You need employee consent or a legal basis (e.g., employment contract). Anonymization and pseudonymization are mandatory for analytics projects. Works councils (in EU) must be involved when implementing HR Analytics.
Which data sources can I use for HR Analytics?
Typical data sources are: HRIS (master data, compensation, absences), ATS (recruiting data, applicant numbers), time tracking (working hours, overtime, productivity), employee surveys (engagement, satisfaction, feedback), objective talent assessment (assessment results, competencies, potentials), and performance reviews (performance reviews, goal agreements).
What are the 4 types of HR Analytics?
The four development stages are: Descriptive Analytics (What happened? e.g., "Turnover was 15%"), Diagnostic Analytics (Why did it happen? e.g., "High turnover due to poor leadership"), Predictive Analytics (What will happen? e.g., "Employee X will resign"), and Prescriptive Analytics (What should I do? e.g., "Introduce leadership coaching").
How do I measure the ROI of HR Analytics?
Typical ROI metrics are: Cost-per-Hire reduction (e.g., 30% savings through better recruiting), reducing turnover (e.g., 10% fewer resignations = €X savings), productivity increase (e.g., 15% higher performance through data-based development), and shortening time-to-hire (e.g., 20 days less = faster value creation). ROI usually becomes measurable after 12-18 months.
Conclusion: HR Analytics as a Strategic Lever
HR Analytics is not a technical buzzword but a strategic lever for successful people management. Those who make decisions based on data instead of gut feelings gain a sustainable competitive advantage.
The numbers speak for themselves: 25% higher productivity, 50% lower turnover, and a measurable contribution to business success. The entry doesn't have to be complicated – even with simple tools like Excel and clear goals, initial successes can be achieved.
What's crucial is the right balance: Data quality over data quantity, focus on strategic KPIs is more important than hundreds of metrics, and data protection is not an obstacle but a necessary framework for ethical analytics practice.
Would you like to use objective talent assessment as a data source for your HR Analytics? The digital platform Aivy provides scientifically validated assessment data that complements your HR analyses with objective, bias-free insights on competencies and potentials. Learn more about objective talent assessment as a data source for HR Analytics.
Sources
- Gartner Inc. (2025). HR Analytics Definition. Gartner Glossary. https://www.gartner.com/en/human-resources/glossary/hr-analytics
- Academy to Innovate HR (AIHR). (2025). What is HR Analytics? AIHR Blog. https://www.aihr.com/blog/what-is-hr-analytics/
- McKinsey & Company. (2023). People Analytics Study. McKinsey Insights.
- Deloitte. (2024). Global Human Capital Trends 2024. Deloitte Research.
- Haufe Group. (2025). HR-Analytics KPIs: Erfolg richtig messen. Haufe HR-Magazin. https://www.haufe.de/hr/magazin/hr-analytics-kpis
- OMR Reviews. (2025). 19 HR-KPIs, die du im Auge behalten solltest. https://omr.com/de/reviews/contenthub/hr-kpis
- Personio GmbH. (2023). People Analytics Guide. Personio HR-Lexikon. https://www.personio.com/hr-lexicon/people-analytics/

Make a better pre-selection — even before the first interview
In just a few minutes, Aivy shows you which candidates really fit the role. Beyond resumes based on strengths.